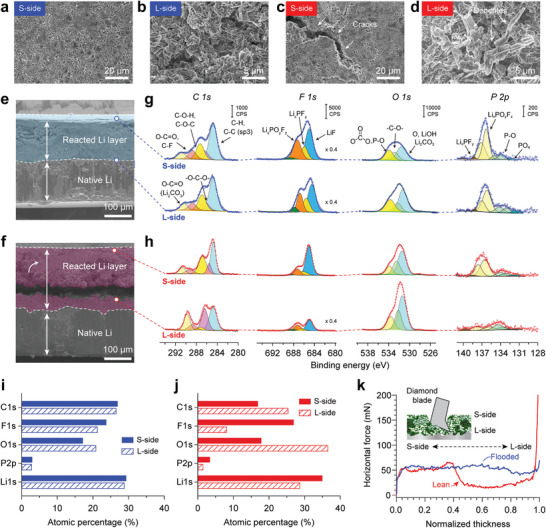
Figure 3.

Postmortem analysis of the reacted Li layer. Top‐view SEM images of a,c) reacted SEI and b,d) native LMA surfaces for flooded (>20 g Ah−1) and lean (≈3 g Ah−1) electrolytes, respectively. e,f) Cross‐sectional SEM images of LMAs after cycling with flooded and lean electrolytes, respectively. High‐resolution XPS spectra obtained at separator (S) and LMA (L) sides of reacted SEI cycled at g) flooded and h) lean electrolyte. Atomic percentages of different elements on SEP and LMA sides of the reacted SEI obtained from the cells with i) flooded electrolyte, j) lean electrolyte. k) Peeling strength of reacted SEI of each LMAs. All samples were collected from Li (200 µm thickness)||NMC622 cells after the 10th cycle.
