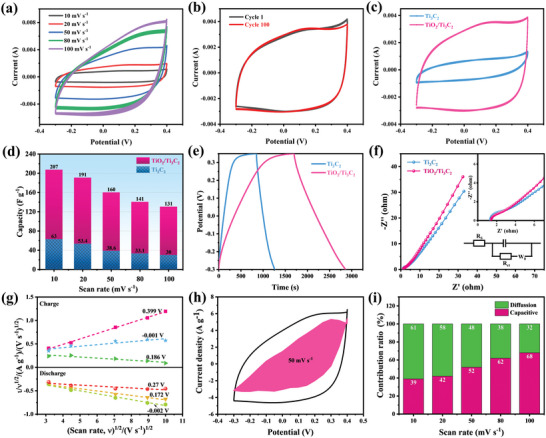
Figure 3.

a) CV curves of TiO2/Ti3C2 at various scan rates; b) CV curves over 100 cycles at a scan rate of 50 mV s−1; c) CV curves of TiO2/Ti3C2 and TiO2 at a scan rate of 50 mV s−1; d) comparison of capacitance between TiO2/Ti3C2 and Ti3C2; e) GCD curves of TiO2/Ti3C2 and Ti3C2 at 0.1 A g−1; f) Nyquist plots of TiO2/Ti3C2 and Ti3C2; g) plots of i/ν 1/2 versus ν 1/2 at various potentials; h) CV curve at 50 mV s−1 where the shaded area represents capacitive contribution; i) capacitive and diffusion contribution ratio at various scan rates.
