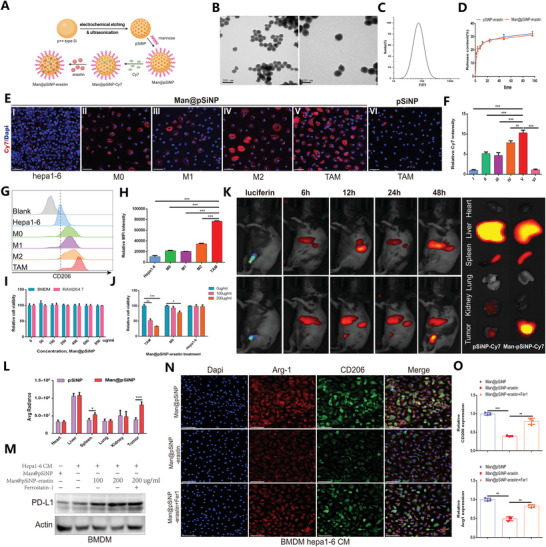
Figure 7.

Man@pSiNP‐erastin specifically targets TAM ferroptosis and protumoral polarization in HCC. A) Schematic illustration of the preparation of pSiNPs. Created with Biorender.com. B) TEM images of pSiNPs. C) Particle size distribution of PSiNPs by DLS analysis. D) In vitro erastin release profiles of pSiNPs‐erastin and Man@pSiNPs‐erastin. E,F) IF staining revealing the specific targeting of Man@pSiNPs compared with pSiNPs (n = 3). The result of was normalized according to the result of Hepa 1–6. G) FCM histogram profiles of fluorescence intensity. H) Quantification of the mean fluorescence intensity by FCM analysis (n = 3). I) Cell viability results showing the potential toxicity of Man@pSiNPs on BMDMs and RAW264.7 cells (n = 3). J) The impact of Man@pSiNPs‐erastin treatment on the viability of TAMs, M0 cells, and Hepa1‐6 cells (n = 3). K,L) In vivo bioluminescence imaging and quantification showing the biodistribution of Man@pSiNPs‐Cy7 in mice (n = 5). M) Expression profiles of PD‐L1 in TAMs in response to different treatments. N,O) IF staining and quantification depicting the infiltration levels of Arg‐1+ macrophages and CD206+ macrophages in response to different treatments (n = 3). The result of was normalized according to the result of Man@pSINP. All data in the figure are represented as the means ± SEM. F,H,J,O,P) 1‐way ANOVA with Tukey's Multiple Comparison test. D,I,L) Student's t‐test. * p < 0.05, ** p < 0.01, *** p < 0.001.
