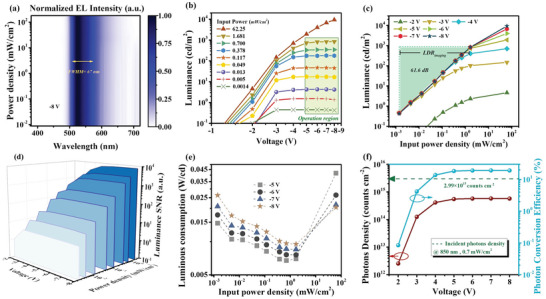
Figure 5.

Characteristics and performance of optical output of the NIR‐OPD. a) The normalized EL spectrum mapping a function of both wavelength and input power density at bias of 8 V under 850 nm light radiation. b) The luminance–voltage curves under different input‐power‐density 850 nm light radiation. c) The luminance as function of input power density with different bias applying and imaging LDR. d) The luminance signal‐noise‐ratio (SNR) and contrast as function of both bias and input power density. e) Luminance consumption as function of both bias and input power density. f) The photos density as function of bias and photon conversion efficiency curves.
