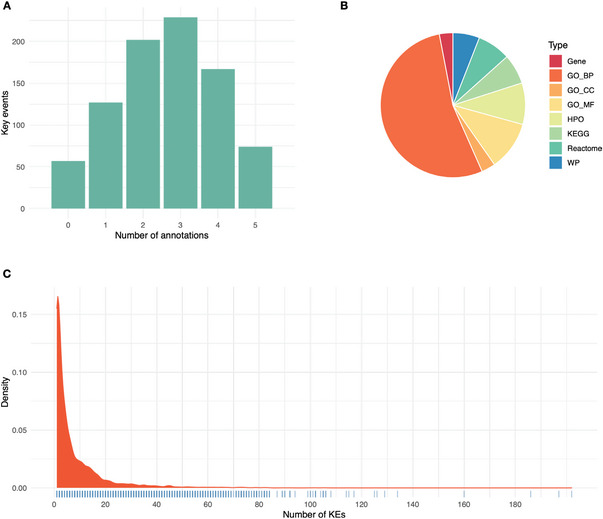
Figure 2.

Descriptive analysis of the KE annotation. A) Bar plot describing the number of annotated terms per KEs. B) Pie chart expressing the proportions of different annotation types. C) Density distribution of the number of KEs each gene is annotated to.
