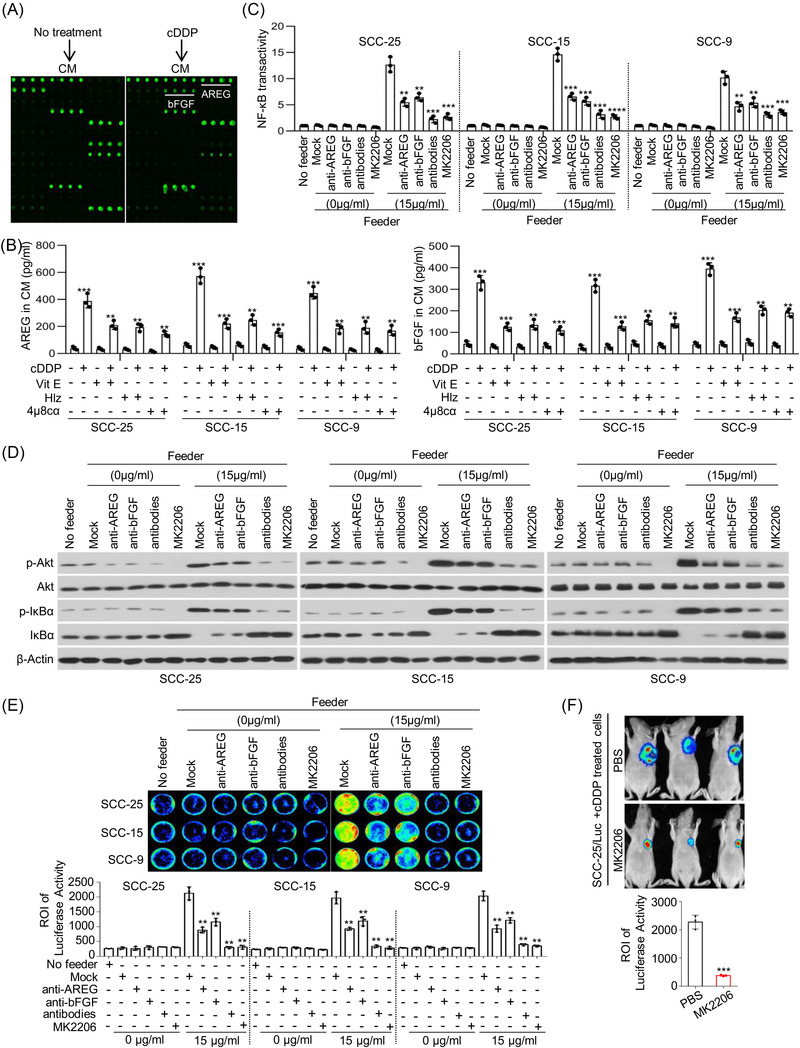
FIGURE 5.

Cytotoxic treatment‐induced dying cells promoted tumour cell repopulation via secretion of amphiregulin (AREG) and basic fibroblast growth factor (bFGF). (A) SCC‐25 cells were treated with or without cisplatin (cDDP) (8 µg/ml) for 24 h, and the conditioned medium (CM) was collected. The differentially expressed cytokines in the CM were identified using a cytokine array. (B) SCC‐25, SCC‐15 and SCC‐9 cells were treated with cDDP in combination with vitamin E (VitE), hydralazine (Hlz) or 4µ8cα for 24 h. The CM from further incubation for 24 h was collected. The protein levels of AREG and bFGF in CM were determined by enzyme‐linked immunosorbent assay (ELISA) (n = 3), ** p < .01, *** p < .001. (C and D) SCC‐25, SCC‐15 and SCC‐9 cells were treated with cDDP for 24 h. Another new SCC‐25, SCC‐15 and SCC‐9 cells were cocultured with feeder cells combination with AREG‐neutralising antibody (1 µg/ml), bFGF‐neutralising antibody (1 µg/ml) and Akt inhibitor MK2206 (800 µM). Transactivation of NF‐κB signalling in mentioned cells was measured by Cignal Reporter Assays (n = 3), ** p < .01, *** p < .001, **** p < .0001 (C). p‐Akt, Akt, p‐IκBα, IκBα and β‐Actin were detected by western blots (D). (E) SCC‐25, SCC‐15 and SCC‐9 feeder cells were treated with cDDP for 24 h. SCC‐25/Luc, SCC‐15/Luc and SCC‐9/Luc reporter cells were cocultured with feeder cells in combination with neutralising antibody against AREG or bFGF or Akt inhibitor MK2206 in 24‐well plates. Cancer cell repopulation in vitro was observed by luciferase activities, ** p < .01. (F) SCC‐25 cells were treated with cDDP for 24 h. SCC‐25/Luc cells were injected subcutaneously together with cDDP‐treated SCC‐25 cells in nude mice to generate xenograft tumours. The mice were randomly grouped and received i.p. injection of MK2206 (300 mg/kg) or phosphate‐buffered saline (PBS) once every 3 days, and tumour growth was represented by luciferase levels, *** p < .001. Data in (B), (C), (E) and (F) are represented as mean ± SEM. Statistical significance was determined by a two‐tailed Student's t‐test
