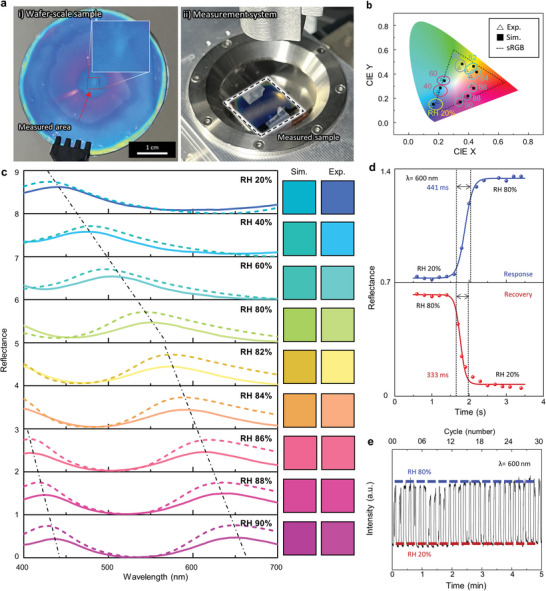
Figure 3.

Demonstration of the PVA F–P etalon. a‐i) A wafer‐scale humid‐responsive F–P etalon is demonstrated and ii) its reflectance spectrum is measured. b) Simulated and experimentally measured color coordinates plotted on the CIE 1931 chromaticity diagram. c) Simulated and experimentally measured reflectance spectra from 400 to 700 nm by varying the RH from 20 to 90% with an initial PVA thickness of 219 nm. d) Response and recovery time plots and e) repeatability of the humidity‐responsive F–P etalon.
