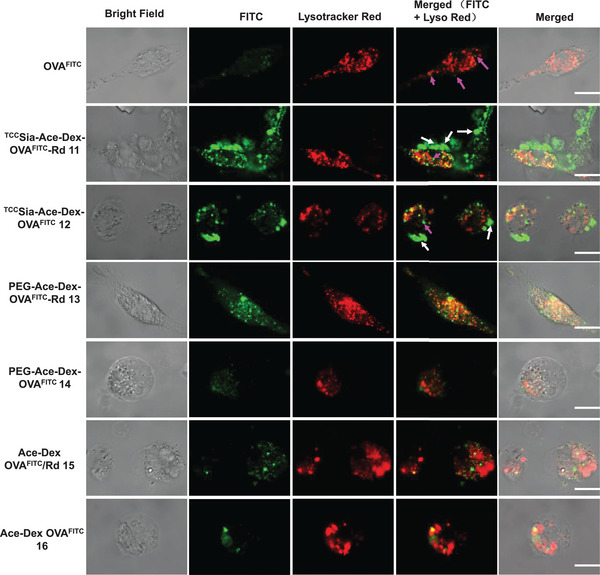
Figure 2.

Colocalization of free OVAFITC, TCCSia‐Ace‐Dex‐OVAFITC‐Rd (11), TCCSia‐Ace‐Dex‐OVAFITC (12), PEG‐Ace‐Dex‐OVAFITC‐Rd (13), PEG‐Ace‐Dex‐OVAFITC (14), Ace‐Dex OVAFITC/Rd (15), and Ace‐Dex OVAFITC (16) within CD169+ bone marrow‐derived macrophages (BMMs) upon incubation with the nanoparticles (NPs; containing the same amount of OVAFITC, 10 µg) for 6 h. The intracellular FITC signals were merged with Lysotracker (Lyso) Red, and the colocalization was shown in yellow. Scale bars: 10 µm.
