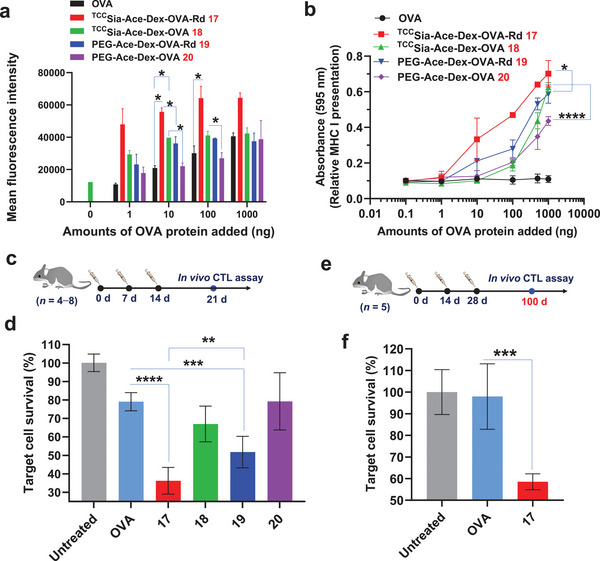
Figure 4.

a) Detection of OVA257−264 presented by MHC‐I of the bone marrow‐derived macrophages (BMMs; CD169+). The BMMs (5 × 10⁵) were incubated with either free OVA, TCCSia‐Ace‐Dex‐OVA‐Rd (17), TCCSia‐Ace‐Dex‐OVA (18), PEG‐Ace‐Dex‐OVA‐Rd (19), and PEG‐Ace‐Dex‐OVA (20) for 24 h. The resulting cells were spiked with PE‐labeled anti‐mouse H‐2Kb/SIINFEKL antibody for 30 min and analyzed by flow cytometry. b) MHC‐I antigen presentation by the BMMs. In vitro cytotoxic T‐lymphocyte (CTL) activation study of B3Z cells cocultured with the BMMs following incubation with free OVA and 17−20, respectively. The error bars show the SD of three replicates. c,d) In vivo CTL activities. Mice were immunized weekly with free OVA and 17−20, respectively (n = 8 mice for the untreated group, n = 4 mice per group for OVA, 18, and 20 injections, n = 6 mice per group for 17 and 19 injections). On day 21, after three vaccinations, a 1:1 of CFSEhiOVA257−264 + and CFSEloOVA257−264 − splenocytes was injected into the immunized and nontreated mice, respectively. After 24 h, their splenocytes were analyzed by flow cytometry. e,f) Persistence of in vivo CTL activities. Mice were immunized subcutaneously by three injections of free OVA or 17 on days 0, 14, and 28, respectively. On day 100, in vivo CTL assay was performed (n = 5 mice per group). The p values are analyzed by a two‐tailed unpaired Student's t‐test (a,d,f) or a two‐way ANOVA Bonferroni posttest (b) with GraphPad Prism 8. *p < 0.05, **p < 0.01, ***p < 0.001, ****p < 0.0001.
