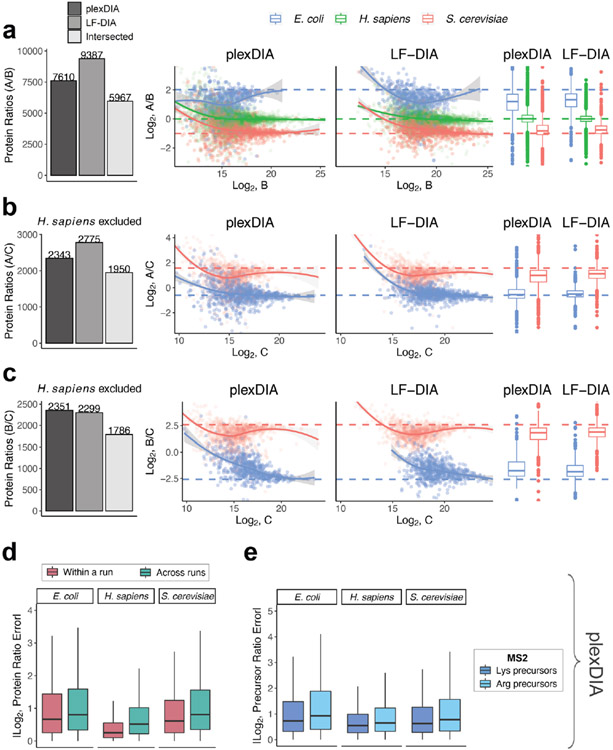
Extended Data Fig. 5 ∣. plexDIA quantitative accuracy for MS2-optimized data acquisition (V2).
As demonstrated with the MS1-optimized method in Fig. 3 of the main text, here we show quantitative accuracy of plexDIA using MS2-optimized data acquisition—specifically, we only show data from the second run of a triplicate set. (a) The number of protein groups quantified in both samples A and B is shown with barplots. plexDIA quantified 7,610 PGs, LF-DIA 9,387 PGs, and intersected between plexDIA and LF-DIA was 5,967 PGs. These 5,967 PGs were plotted to compare quantitative accuracy between plexDIA and LF-DIA for in-common protein groups. To improve visibility, the scatter plot x and y axes were set to display data points between 0.25% and 99.75% range. (b) Same as (a), but for samples A and C; human proteins were excluded because they compare two different human cell types. (c) Same as (b), but for samples B and C. (d) Absolute protein ratio errors were calculated for samples A/B, A/C and B/C and combined to compare ratio errors for samples within a plexDIA run (for example, run2 A / run2 B) to samples across runs (for example, run1 A /run2 B) with plexDIA. (e) Absolute precursor ratio errors were calculated for samples A/B, A/C and B/C and combined to compare MS2-quantified ratio errors for C-terminal lysine precursors and C-terminal arginine precursors. Boxplots: The box defines the 25th and 75th percentiles and the median is marked by a solid line. Outliers are marked as individual dots outside the whiskers. All data shown are from (n = 1) representative replicate.

