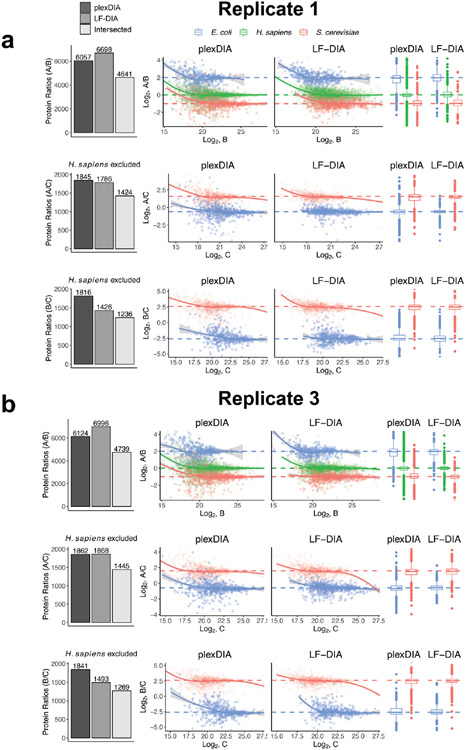
Extended Data Fig. 6 ∣. Quantitative accuracy for DIA replicates using V1.
Similar to main Fig. 3, we display the results from the other replicates for a total of (n = 3) replicates. (a) Figures are the same as shown in Fig. 3 of the main text with the exception that this shows the first replicate of plexDIA and the first replicate of samples A, B and C for LF-DIA. (b) Same as (a), but for the third replicate of plexDIA and LF-DIA, samples A, B and C. Boxplots: The box defines the 25th and 75th percentiles and the median is marked by a solid line. Outliers are marked as individual dots outside the whiskers. Panel a shows data from (n = 1) replicate and panel b shows data from another (n = 1) replicate for a total of (n = 2) replicates shown in this figure.

