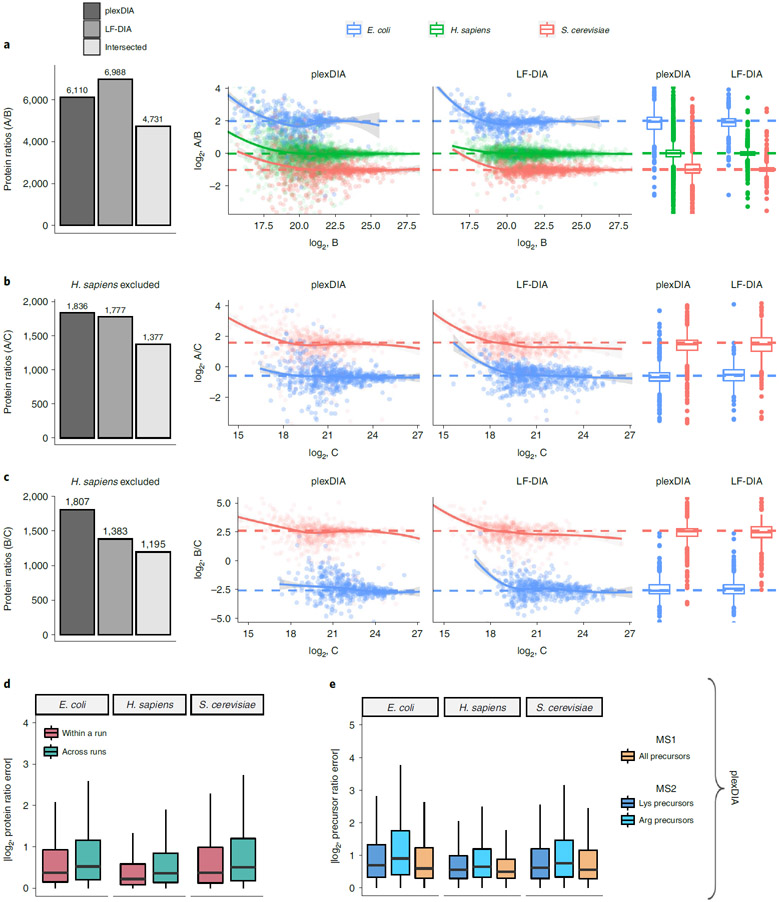
Fig. 3 ∣. Quantitative accuracy and precision of plexDIA and LF-DIA.
a, Bars correspond to the number of quantified protein ratios between samples A and B by plexDIA, by LF-DIA or by both methods (intersected proteins). To improve visibility, the scatter plot x and y axes were set to display data points between the 0.25% and 99.75% range. b, Same as a but for samples A and C. c, Same as a but for samples B and C. The protein ratios displayed in a–c are estimated from a single replicate, and two more replicates are shown in Extended Data Fig. 6. d, A comparison between the errors within and across plexDIA sets indicates similar accuracy. The error is defined as the difference between the mixing and the measured protein ratios for all pairs of samples, A/B, A/C and B/C. The absolute values of these errors are displayed for samples within a plexDIA set (for example, run2 A / run2 B) and for samples across sets (for example, run1 A / run2 B). The corresponding accuracy within and across plexDIA for the V2 methods is shown in Extended Data Fig. 5. e, Absolute precursor ratio errors were calculated for samples A/B, A/C and B/C and combined to compare ratio errors for MS1 and MS2 quantification. The MS2 quantification of precursors having C-terminal lysine or arginine is shown separately. Boxplots: The box defines the 25th and 75th percentiles, and the median is marked by a solid line. Outliers are marked as individual dots outside the whiskers.

