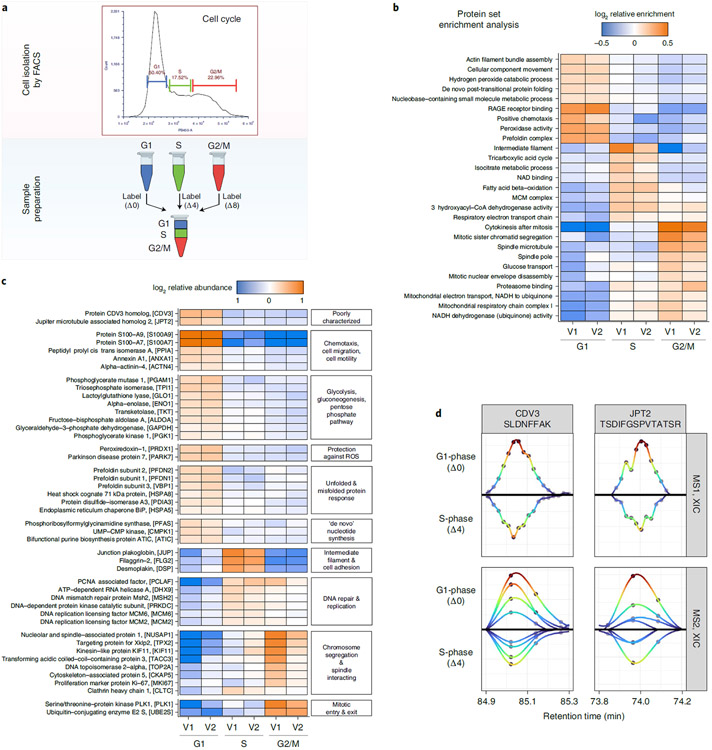
Fig. 5 ∣. Cell cycle analysis with plexDIA.
a, U-937 monocytes were sorted by FACS based on DNA content to separate into G1, S and G2/M cell cycle phases. The samples were prepared as a plexDIA set and then analyzed with MS1-optimized and MS2-optimized data acquisition methods (referred to as V1 and V2, respectively). b, PSEA of cell cycle phases from plexDIA data. c, A subset of proteins found to be differentially abundant at 1% FDR across cell cycle phases was grouped by function and then plotted to show the relative abundances across cell phases. d, XICs at MS1 and MS2 for precursors from poorly characterized proteins, CDV3 and JPT2.

