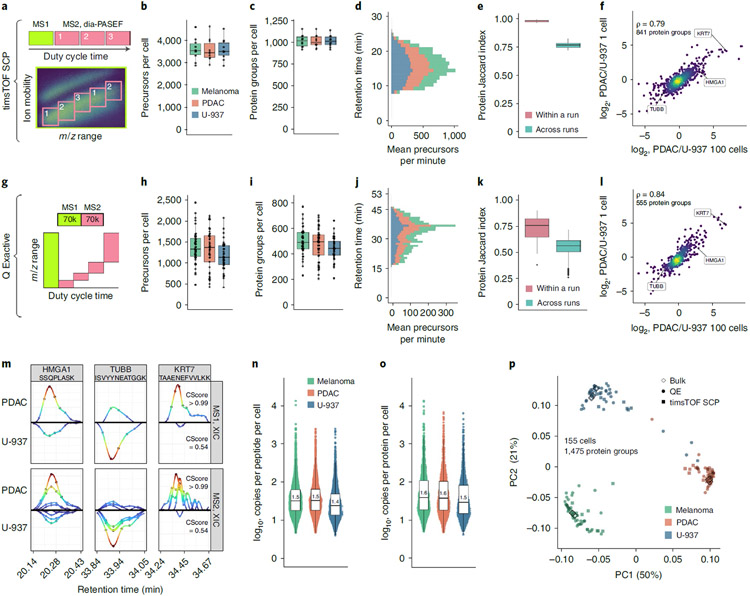
Fig. 6 ∣. Single-cell protein analysis with plexDIA.
a, Cartoon visualizing the duty cycle used to analyze single-cell plexDIA sets with timsTOF SCP. Number of precursors (b) and protein groups (c) identified per single cell—data for (n = 30) single cells. d, Mean number of precursors identified from each cell type per minute of chromatographic gradient. e, Data completeness measured by Jaccard index within and between plexDIA sets—data for (n = 10) sets. f, Comparison of protein fold changes estimated from bulk samples (100 cells, x axis) or single cells (y axis). Panels g–l show analogous results to a–f but for data from a Q Exactive classic. Panels h and i show data for (n = 125) single cells, and panel k shows data for (n = 48) sets. m, XICs for precursors (MS1 level) and for peptide fragments (MS2 level) for peptides from differentially abundant proteins, HMGA1, TUBB and KRT7; data are from single cells analyzed by Q Exactive. Median number of copies for each peptide (n) and protein group (o), per single cell; data are from single cells analyzed by Q Exactive. Each distribution in n has (n > 1,800) peptides, and each distribution in o has (n > 700) proteins. p, PCA of 155 single cells, including both the cells analyzed by timsTOF SCP or by Q Exactive. The single cells are projected together with plexDIA triplicates of 100-cell bulk samples analyzed by Q Exactive. All peptides and proteins shown are at 1% FDR. Boxplots: The box defines the 25th and 75th percentiles, and the median is marked by a solid line. Outliers are marked as individual dots outside the whiskers. PC, principal component; QE, Q Exactive.

