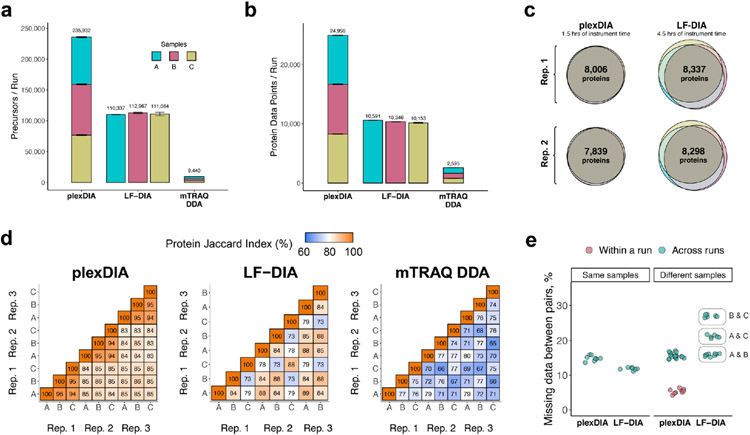
Extended Data Fig. 3 ∣. plexDIA proteomic coverage and data completeness for V2.
(a) Number of distinct precursors identified from 60 min active gradient runs for plexDIA, LF-DIA, and shotgun-DDA of mTRAQ at 1 % FDR. The DIA analysis used the V2 method, an MS2-optimized data acquisition cycle shown in Fig. 1e. Triplicates of each sample were analyzed (except sample C of LF-DIA, duplicates are analyzed), and the results displayed as mean; error bars correspond to standard error. (b) Total number of protein data points for plexDIA, LF-DIA and mTRAQ DDA at 1 % global protein FDR, (n = 3). (c) Venn-diagrams of each replicate for plexDIA and LF-DIA display protein groups quantified across samples A, B and C. The mean number of proteins groups intersected across samples A, B and C is 7,923 for plexDIA and 8,318 for LF-DIA. (d) We compute pairwise Jaccard indices to compare pairwise data completeness between plexDIA, LF-DIA and shotgun DDA for mTRAQ. All data were analyzed using match between runs. (e) Distributions of missing data between pairs of runs of either the same sample (that is, replicate injections) or between different samples.

