
FIGURE 3.
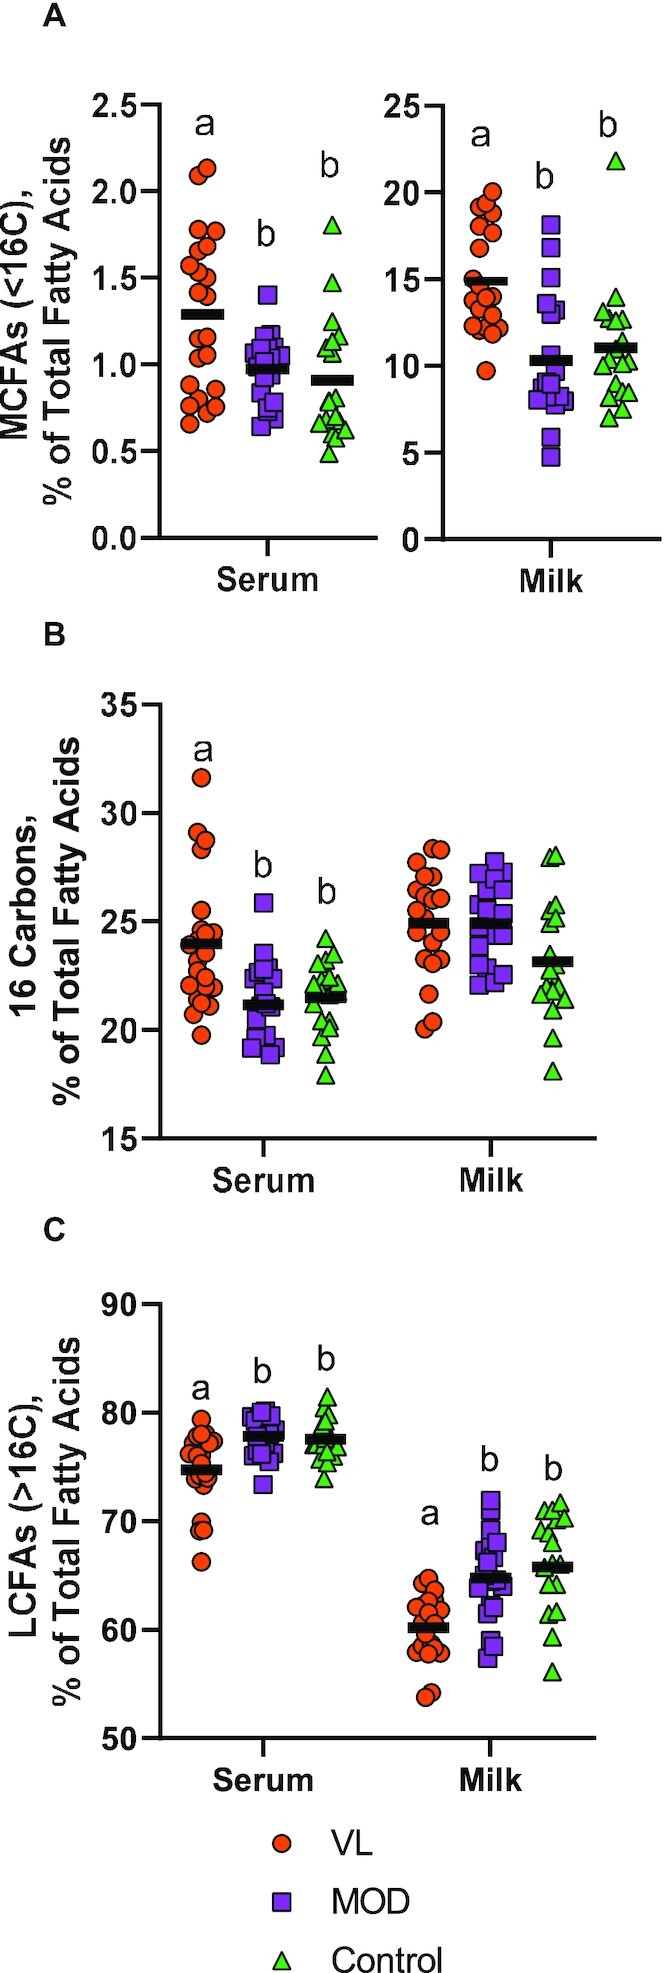
Differences in fatty acid profile of mothers with very low milk production, moderate milk production, and controls. Milk production groups were defined as VL (<300 mL/d), MOD (≥300 mL/d), and control (externally recruited controls who were exclusively breastfeeding infants with healthy weight gain). Individual values (shapes) and group means (horizontal lines) are shown for both serum and milk for (A) MCFAs (<16 carbons), (B) 16-carbon fatty acids, and (C) LCFAs (>16 carbons). Differences in means were assessed using 1-factor ANOVA with Bonferroni adjustment for multiple comparisons. Group means with different letters were statistically significantly different (P < 0.05). A serum sample was unavailable for 1 participant: VL, n = 22; MOD, n = 20; and control, n = 18. Milk samples were unavailable for fat analysis for 4 participants: VL, n = 20; MOD, n = 19; and control, n = 18. LCFA, long-chain fatty acid; MCFA, mid-chain fatty acid; MOD, moderate milk production group; VL, very low milk production group.