
FIGURE 4.
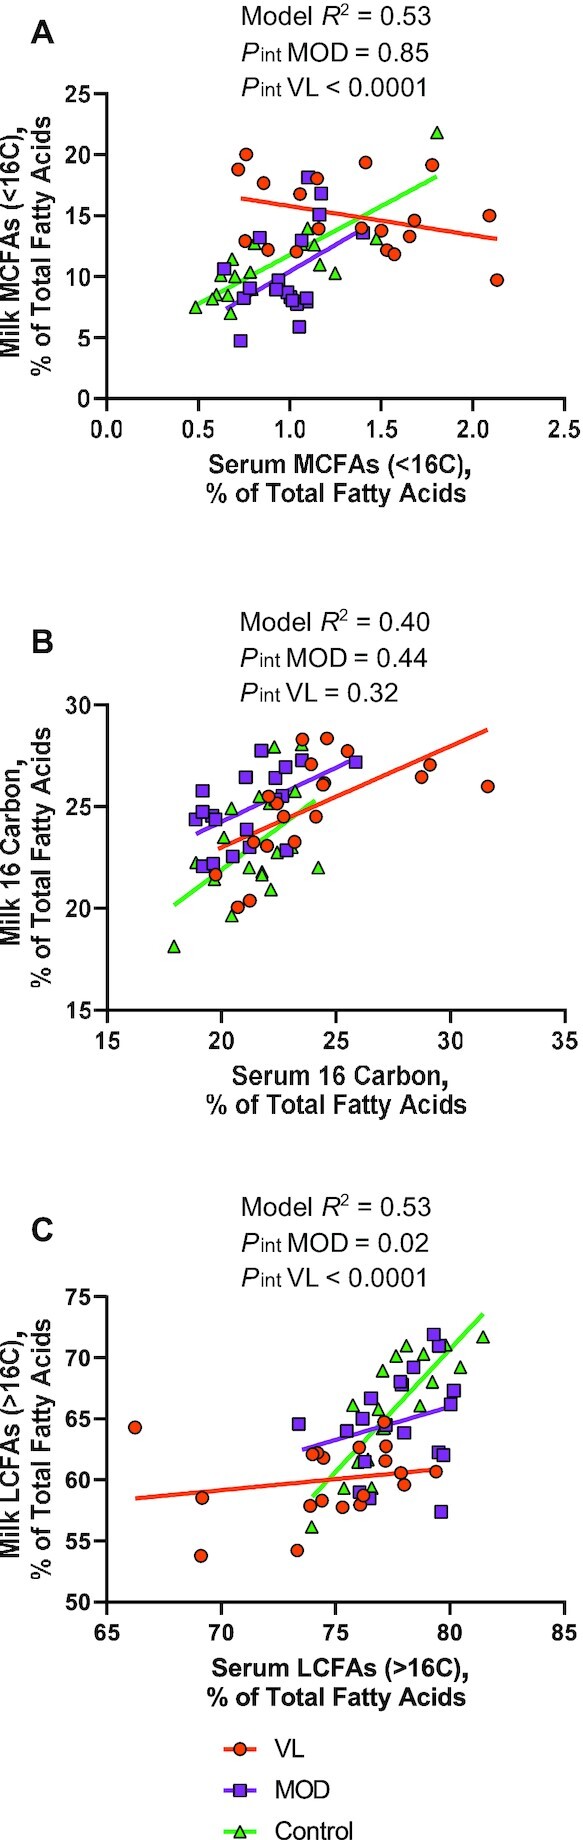
Association between serum and milk fatty acid profiles of mothers with very low milk production, moderate milk production, and controls. Milk production groups were defined as VL (<300 mL/d), MOD (≥300 mL/d), and control (externally recruited controls who were exclusively breastfeeding infants with healthy weight gain). Serum fatty acids (exposure) were used to predict milk fatty acids (outcome) using linear regression. Production group, and serum fatty acid-by-group interaction, were included in the model to assess differences in the association by milk production. In the interaction analysis, the VL and MOD milk production groups were compared with the controls as the reference group. Model results are shown for (A) MCFAs (<16 carbons), (B) 16-carbon fatty acids, and (C) LCFAs (>16 carbons). A serum sample was unavailable for 1 participant and milk samples were unavailable for fat analysis for 4 participants: VL, n = 19; MOD, n = 19; and control, n = 18. LCFA, long-chain fatty acid; MCFA, mid-chain fatty acid; MOD, moderate milk production group; VL, very low milk production group.