Figure 3.
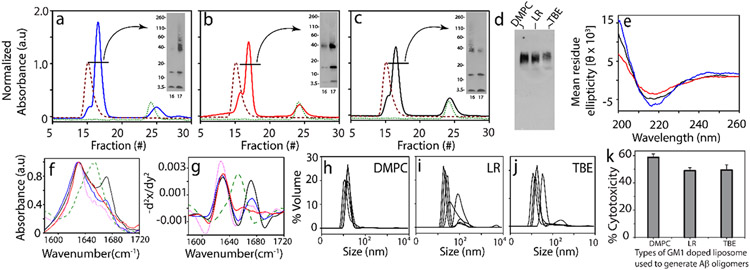
(a–c) SEC chromatogram for isolation of Aβ oligomers generated in the presence of 50% GM1-enriched DMPC (blue), LR (red), and TBE LUVs (black), respectively; LUV control at 0.3 mg/mL (red) and control Aβ (green) at 5 h (inset: SDS PAGE immunoblots of SEC-isolated oligomer fraction 16–17). (d) Native PAGE immunoblot for SEC-isolated Aβ oligomers generated in the presence of 50% GM1-enriched DMPC, LR, and TBE LUVs, respectively, (e) CD spectra of fraction 17 of SEC-isolated Aβ oligomers generated in the presence of 50% GM1-enriched DMPC (blue), LR (red), and TBE LUVs (black), respectively. (f) FTIR spectra of SEC-isolated Aβ oligomers generated in the presence of 50% GM1-enriched TBE (black), DMPC (blue), and LR (red) LUVs; homotypic Aβ fibril (pink) and BSA control (green), respectively. (g) Negative of double derivative of the FTIR spectra (Figure 3f-j) DLS for fraction 17 of SEC-isolated Aβ oligomers generated in the presence of 50% GM1-enriched DMPC, LR, and TBE LUVs, respectively. (k) XTT assay performed on SHY5Y neuroblastoma cells upon incubation with isolated Aβ oligomers from 50% GM1-enriched DMPC, LR, and TBE LUVs, respectively, expressed in terms of % of dead cells. n = 3 independent cell cultures on isolated oligomers, statistically significant at p < 0.05 based on one-way ANOVA.

