Figure 5.
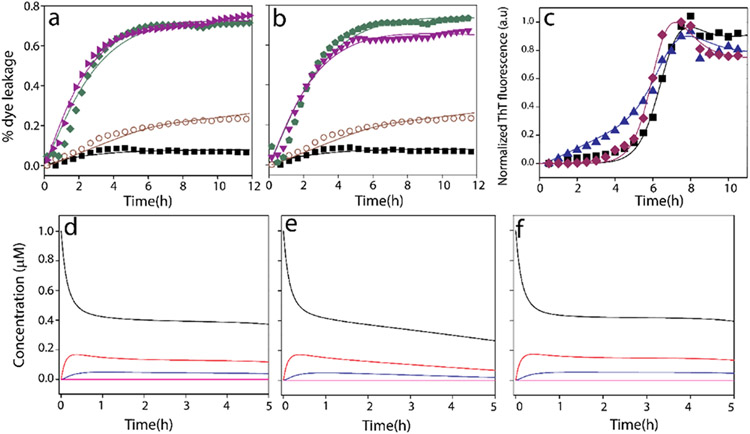
Computational fits of 6-carboxyfluorescein dye leak assay of TBE LUVs (a) with 50% GM1 and 10 μM Aβ monomers (○), without GM1 and 10 μM Aβ monomers (■, black), with 50% GM1 and 2 μM Aβ fibrils (▶, purple), without GM1 and 2 μM Aβ fibril (◆, green) (b) with 50% GM1 and 10 μM Aβ monomers (○), without GM1 and 10 μM Aβ monomers (■), with 50% GM1 and 2 μM sonicated Aβ fibrils (▼, purple), without GM1 and 2 μM sonicated Aβ fibril ( , green). (c) Normalized ThT fluorescence kinetics of buffered 10 μM Aβ without (■; control) or with TBE LUVs each of them enriched with 50 (▲, blue) % GM1 ganglioside (by wt.) or without (◆, brown) GM1 in the presence of 50 mM NaCl in 10 mM sodium phosphate buffer pH 8.00; Aβ monomers (A1 (black), oligomers A2 (red) and A3 (blue), and fibrils F (pink)) distribution plots for first 5 h from the start of reactions of Aβ monomers with TBE LUVs, (d) no GM1, (e) 50% GM1 or (f) without LUVs.

