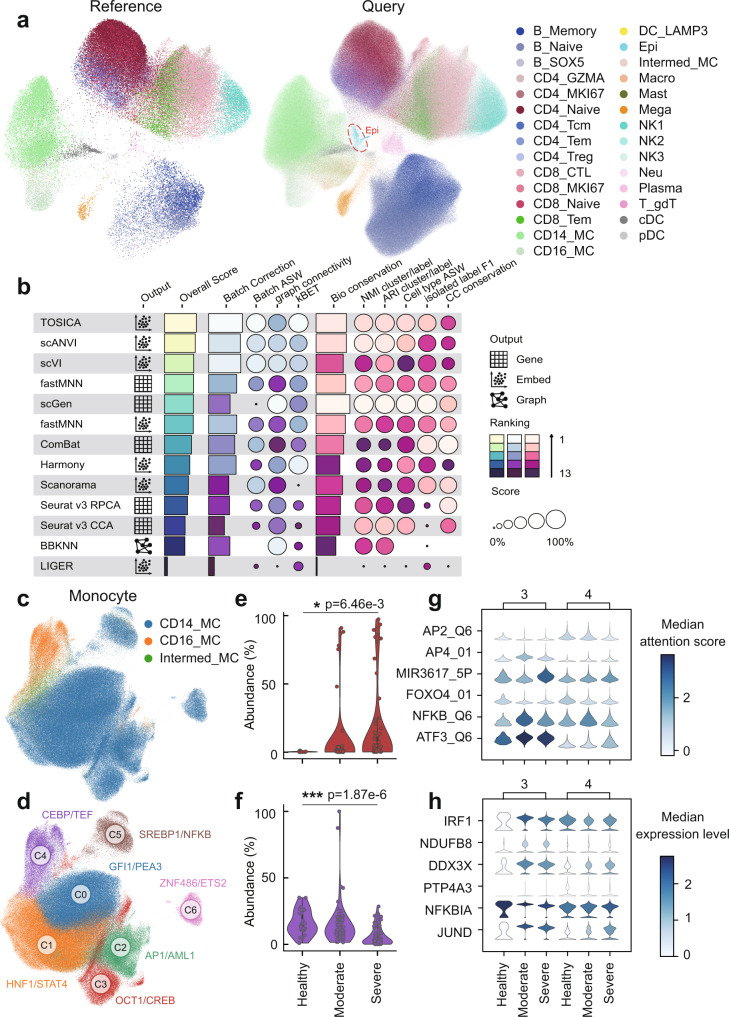
Fig. 5. TOSICA reveals change in transcription factor activity during moderate and severe COVID-19.
a TOSICA predicts cell types reliably across different cell types even when using healthy individuals as reference (left) and COVID19 patients as query (right). Colors denote 29 origin labels. Red circled cell types are unique in query. b Comparison of integration accuracy on query data places TOSICA first among 13 methods. Each score is minimum–maximum scaled between 0 and 1. Overall scores are computed using a 40:60-weighted mean of batch correction and bio-conservation scores. c, d TOSICA attention score based UMAP predicts 3 known (c) and 6 novel (d) monocyte types. e, f Subtype 3 monocytes increases (e) and subtype 4 decreases (f) in abundance from healthy (N = 25), to moderate (N = 79), and to severe (N = 91) COVID-19. Statistical test is two-sided. * RCC p < 0.05; ***p < 0.001. g TOSICA attention score of 6 transcription factors distinguishes subtype 3 and 4 monocytes across different states of COVID19. h The expression levels of major targets of the 6 TFs (g) generally show consistent trends with TFs attention score. Source data are provided as a Source data file.

