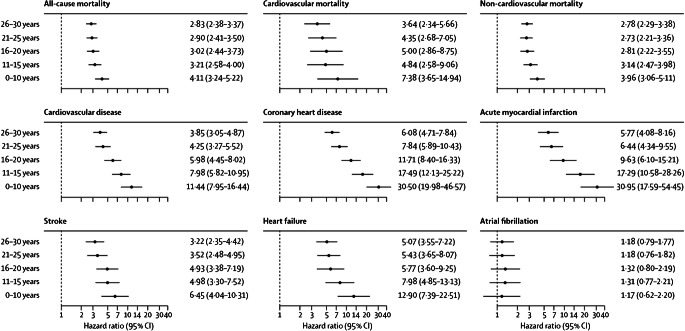
Fig. 3.
Forest plot showing adjusted HRs for mortality and cardiovascular outcomes, according to age at type 1 diabetes diagnosis. Analyses were based on Cox regression and adjusted for pre-existing comorbidities, calendar year, income, country of birth, marital status, educational attainment, and duration of diabetes. Matched controls served as a reference group for all models. Reproduced from [28], with permission from Elsevier. This figure is available as part of a downloadable slideset

