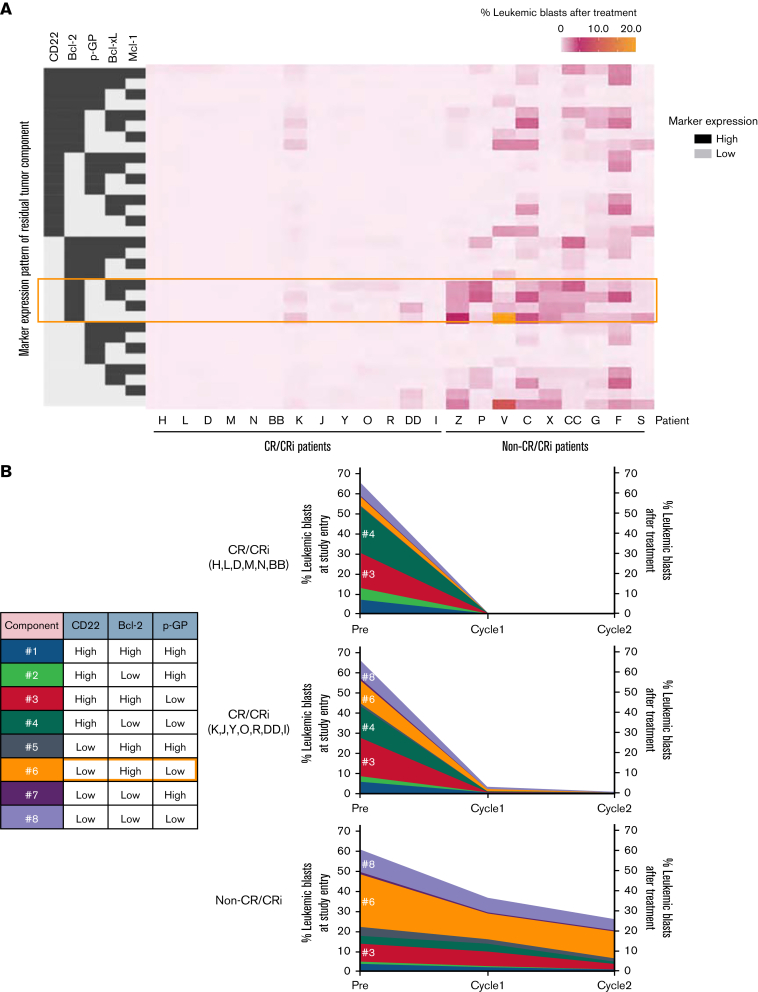
Figure 2.
Residual leukemia cell profiling. (A) Heatmap data display residual leukemia cell composition after InO treatment. Tumor composition by expression patterns of 5 markers (from a total of 35 markers) are described by using grayscale (high expression, dark gray; low expression, light gray). The orange-colored outline highlights CD22lowBcl-2highp-GPlow cells. Data represent CR/CRi patients (n = 13) and non-CR/CRi patients (n = 9) with MRD ≥0.1% in marrow cells. (B) Longitudinal change of leukemia cell composition characterized by CD22, Bcl-2, and p-GP expression at each time point. Numbers in the table inset indicate the blasts with a unique composition of the 3 markers represented. CR/CRi patients were divided into 2 groups based on the absence or presence of persisting blasts as per the heatmap data in panel A and listed. Data represent the average frequency of cells with the CD22/Bcl-2/p-GP composition as described in the table for CR/CRi patients without residual blasts (n = 6, top), CR/CRi patients with residual blasts (n = 7, middle), and non-CR/CRi patients (n = 9, bottom). The scale of residual blasts at the end of cycle 1 and cycle 2 is displayed on the right side.

