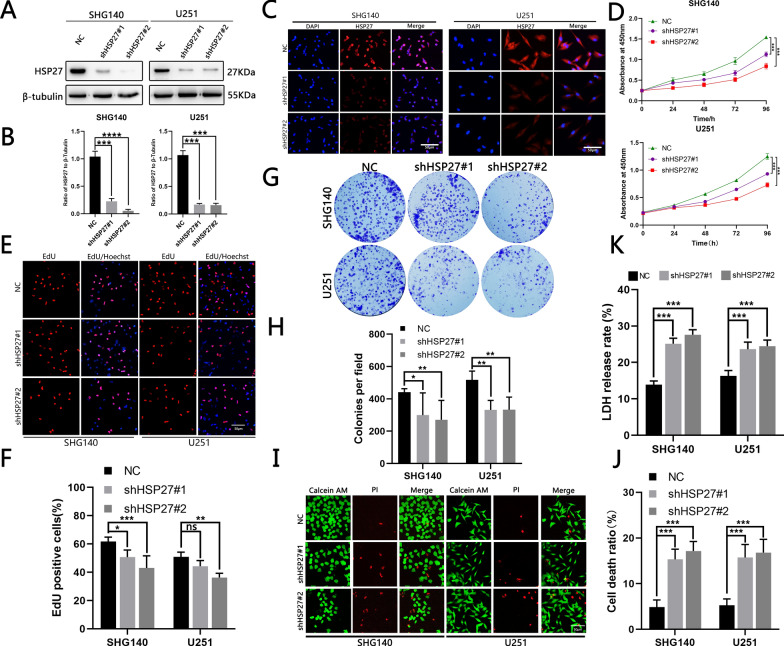
Fig. 2.
Silencing of HSP27 inhibits GBM cell viability and proliferation. A, B Western blotting verified shHSP27 transfection efficiency. C Immunofluorescence verified transfection efficiency, red fluorescence represents HSP27 expression, blue represents the nucleus, scale bar = 50 μm. D Growth curves for SHG140 and U251 cells before and after transfection, OD 450 nm at 24, 48, 72, and 96 h. E, F The EdU assay shows the fluorescence image and positive ratio before and after transfection of SHG140 and U251 cells. The red image represents EdU proliferation and the blue image represents EdU expression. G, H Colony formation experiments assessed the proliferation capacity of SHG140 and U251 cell lines before and after transfection of shHSP27, fixation of cells with 4% paraformaldehyde, and staining with crystal violet. I, J Fluorescence images of dead cells/live cells of the SHG140 and U251 cell lines before and after transfection of shHSP27, red represents dead cells, green represents living cells, scale bar = 50 μm. K LDH release in SHG140 and U251 cells before and after transfection with shHSP27. Student’s t-test for two-group comparison: NSP > 0.05, *P < 0.05, **P < 0.01, ***P < 0.001,****P < 0.0001; one-way ANOVA for multi-group comparisons: NSP > 0.05, *P < 0.05, **P < 0.01, ***P < 0.001, ****P < 0.0001

