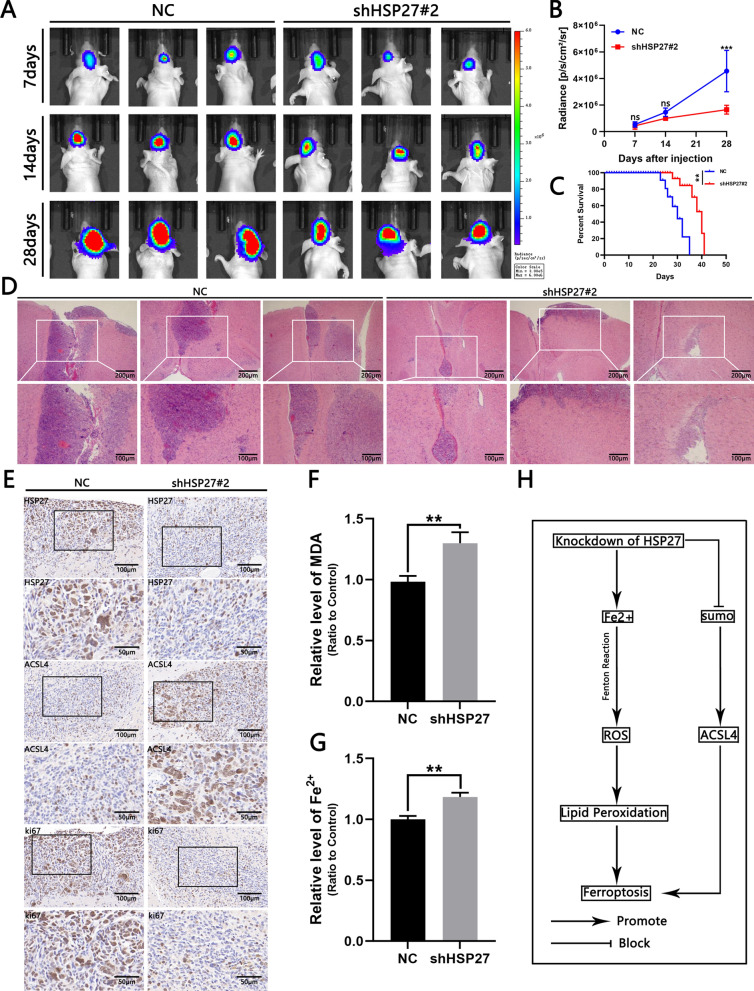
Fig. 6.
Knockdown of HSP27 inhibits tumor growth in vivo. A Fluorescent images of intracranial tumor size in mice on days 7, 14, and 28 in the control and experimental groups. B Quantitative analysis of fluorescence images. C Mouse survival curves of control and experimental groups, n = 6. D H&E slice of mouse intracranial tumor, scale bar = 100 μm. E IHC image of anti-HSP27, Ki67 and ACSL4 tumor slices, scale = 100 μm. F, G Comparison of Fe2 + and MDA levels of xenograft samples in the control and experimental groups. H Schematic of HSP27 inducing ferroptosis in GBM. Student’s t-test for two-group comparisons: *p < 0.05, **p < 0.01, ***p < 0.001; log-rank test: p < 0.05

