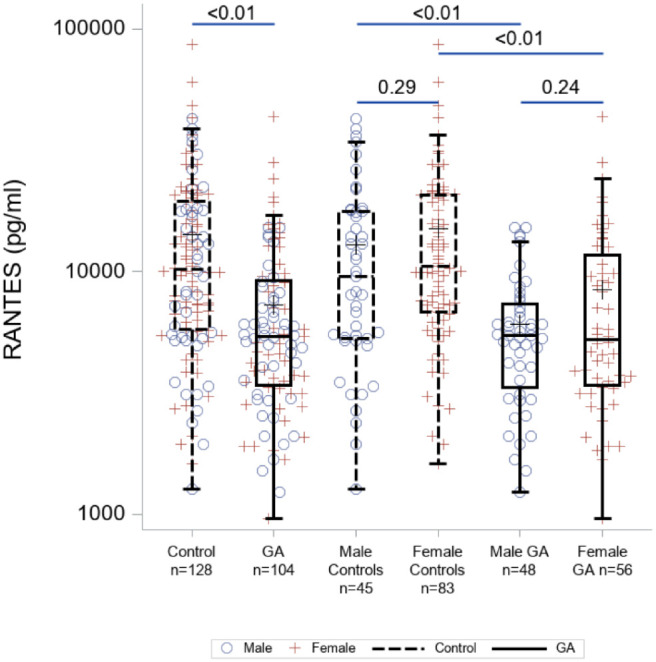
Figure 2.

Boxplot showing the RANTES levels for GA AMD patients and controls stratified by sex. The box extends to the 25th and 75th percentiles, the line represents the median. Individual colored circles/plus points illustrate the observed values. Y-axis tick marks are displayed on a log (10) scale. Male patients are represented as blue circles and female patients are represented as red plus signs.
