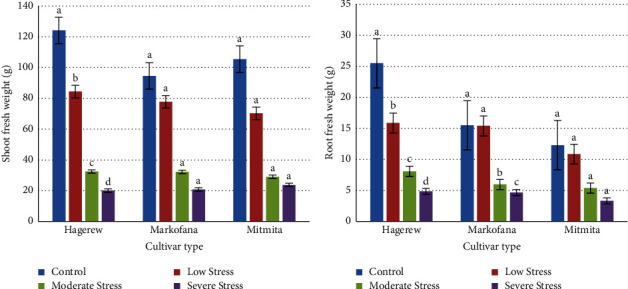
Figure 7.

(a) Effect of drought stress on the shoot. (b) Root fresh weight of the three cultivars. Columns with different letters are the mean values ± SE of the three replicates. Bars with different letters show significant differences at p < 0.05 (LSD).
