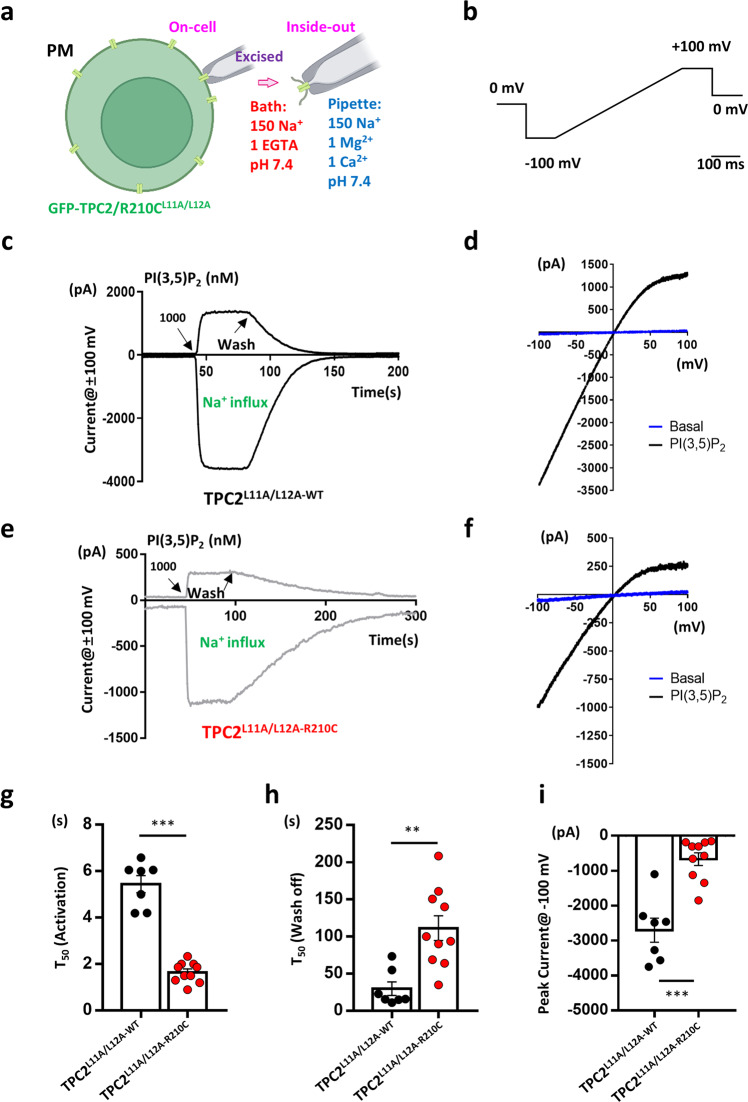
Fig. 2. Inside-out recordings of plasma membrane-targeted TPC2 show altered kinetics of TPC2R210C variant in response to PI(3,5)P2.
a A cartoon depicting the plasma membrane (PM) localization of the TPC2 mutant at the di-leucine motif (L11 and L12 at the N-terminus), TPC2L11A/L112A, and the patch-clamp configurations using for results shown in Figs. 2–4. The main cation compositions of the pipette solution (in blue) and the bath solution (in red) are listed. Figures 2, 3, and 4c–f show currents recorded in the inside-out period. PI(3,5)P2-diC8 and other phosphoinositides were applied through perfusion to the cytoplasmic side of the membrane. Figure 4a shows currents recorded in on-cell period, followed by that in the inside-out period. The scheme is drawn using BioRender with permission. b Voltage ramp protocol used to elicit ionic currents. c Representative traces of TPC2L11A/L12A-WT currents before and during the application of 1 µM PI(3,5)P2-diC8 and after the wash-off of the agonist. The upper trace represents outward current at +100 mV reflecting Na+ efflux to the extracellular (pipette) side, while the lower trace represents the current at −100 mV reflecting Na+ influx into the cytosol (bath), which is equivalent to lysosomal Na+ efflux. Note, only the inward current was used for quantification. d Current-voltage (I-V) relationships at basal and the peak of PI(3,5)P2-evoked response corresponding to (c) generated by the voltage ramp protocol shown in (b). A bend-over was observed at potentials higher than +40 mV, which is typical for TPC2. e, f Representative traces of TPC2L11A/L12A-R210C currents (e) and I-V curves (f) showing fast activation but slow wash-off kinetics of the mutant channel as compared to the WT. g, h Analysis of time to half maximum current (T50) for PI(3,5)P2-diC8 induced activation (T50 activation, 5.4 ± 0.4 s for WT, n = 7; 1.7 ± 0.1 for R210C, n = 10) (g) and the time to half current wash-off (T50 wash-off, 29.9 ± 9.2 s for WT, n = 7; 111.1 ± 16.7 s for R210C, n = 10) (h). i Analysis of the peak current amplitude at −100 mV evoked by PI(3,5)P2-diC8. Data in (g–i) are presented in mean ± SEM, ∗∗p < 0.01, ∗∗∗p < 0.001, by Student’s unpaired t-test, two-tailed. Source data are provided as a Source Data file.

