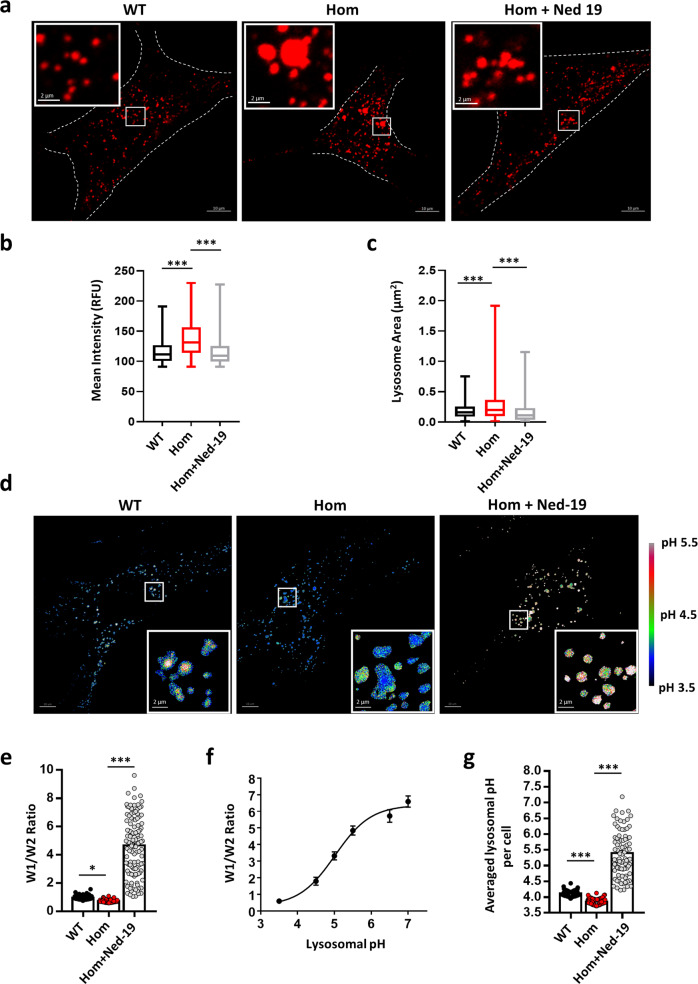
Fig. 8. Tpcn2 R194C knock-in MEFs display hyper-acidification and enlarged vacuolar lysosomes.
a Representative images of MEFs stained with LysoTracker Red. WT and Hom MEFs were used. For some Hom MEFs, Ned-19 (100 nM) was applied together with LysoTracker Red. Scale bars in main images: 10 µm; in the insets: 2 µm. b Statistics of average intensity (in RFU, random fluorescence unit) of LysoTracker fluorescence. Lysosomes were recognized by using the particle function of Image J software with the same threshold. The minimum, maximum, median, first quartile, third quartile for WT (n = 1281): 91.00, 191.2, 118.10, 100.50, 126.90; for Hom (n = 1216): 91.00, 229.90, 136.70, 114.30, 156.30; and for Hom + Ned-19 (100 nM, n = 1038): 91.00, 227.40, 117.20, 99.66, 125.70. Data were collected from 10 cells from each group seeded in three independent dishes. c Statistics of average area (µm2) of lysosomes recognized by LysoTracker Red. The minimum, maximum, median, first quartile, third quartile for WT (n = 1281): 0.010, 0.750, 0.200, 0.089, 0.256; for Hom (n = 1216): 0.010, 1.914, 0.293, 0.100, 0.365; and for Hom + Ned-19 (100 nM, n = 1038): 0.010, 1.154, 0.162, 0.039, 0.230. d Representative ratiometric (W1/W2) H+ images for WT and Hom MEFs and Hom MEFs treated with Ned-19 (100 nM). A rainbow lookup table on the right shows the calibration. Scale bars in main images: 10 μm; in the insets: 2 µm. This assay was repeated three times. e–g Statistics of average LysoSensor ratio (e) and lysosomal pH (g) determined using the calibration curve (f). Lysosomes were recognized by threshold and selection function and ratiometric images were generated by image calculator function of Image J software. The W1/W2 ratios e are: WT, 1.280 ± 0.010 (n = 117); Hom, 0.950 ± 0.009 (n = 110), and Hom + Ned-19 (100 nM), 5.05 ± 0.19 (n = 124). The lysosomal pH values (g) are: WT, 4.11 ± 0.01 (n = 117); Hom, 3.85 ± 0.01 (n = 110), and Hom + Ned-19 (100 nM), 5.40 ± 0.08 (n = 124). Data were collected from 10 cells from each group seeded in three independent dishes. Data in (e, g) are presented in mean ± SEM, ∗p < 0.05, ∗∗∗p < 0.001, by one-way ANOVA. Source data in (b, c, e–g) are provided as a Source Data file.

