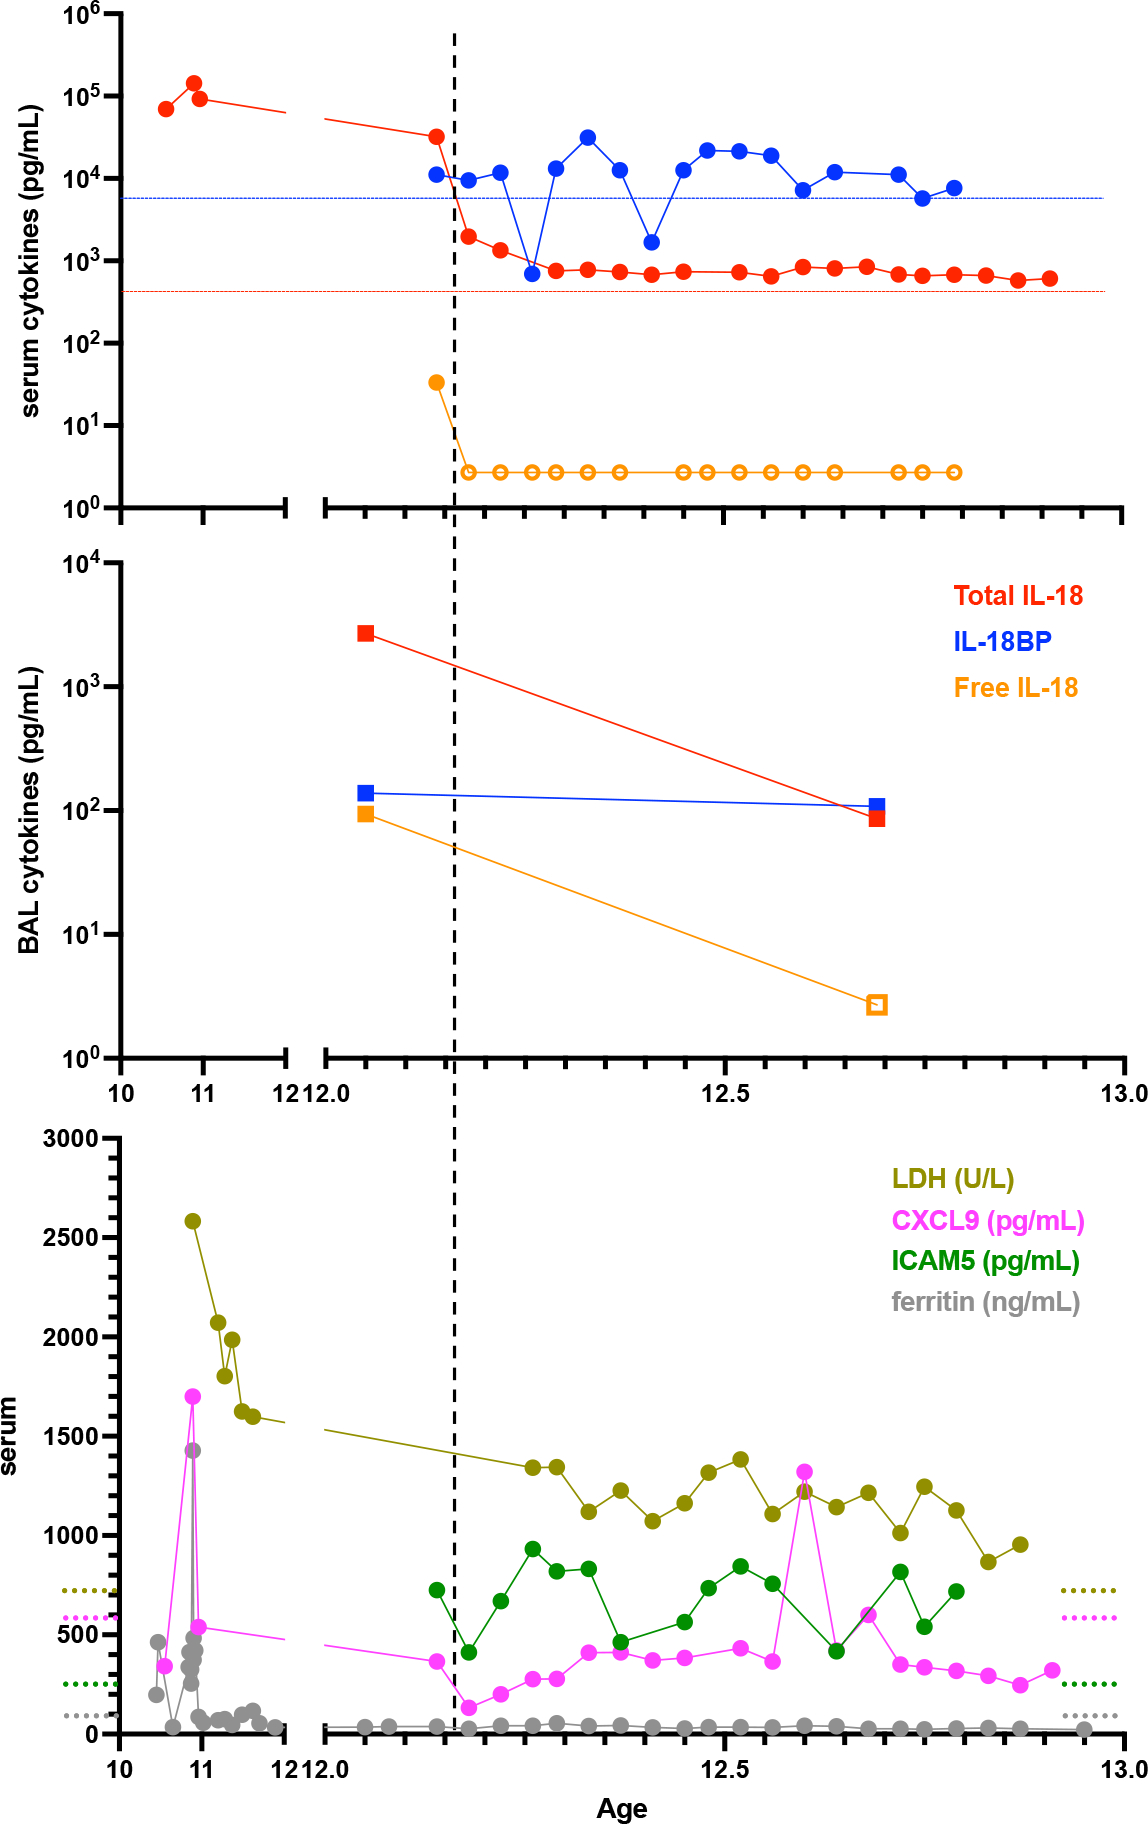
Figure 3: Longitudinal assessment of serum and BAL biomarkers.

Patient serum (A) and BAL fluid (B) cytokines were assessed for total IL-18, IL-18BP, and Free IL-18. (C) Serum CXCL9, LDH, ICAM5, and ferritin. Dashed horizonal lines represent upper limits of normal except blue and green lines, which represent the highest values among six healthy control patients for IL-18BP and ICAM5, respectively (data not shown). Open shapes indicate below limit of detection. Vertical line indicates initiation of MAS-825.
