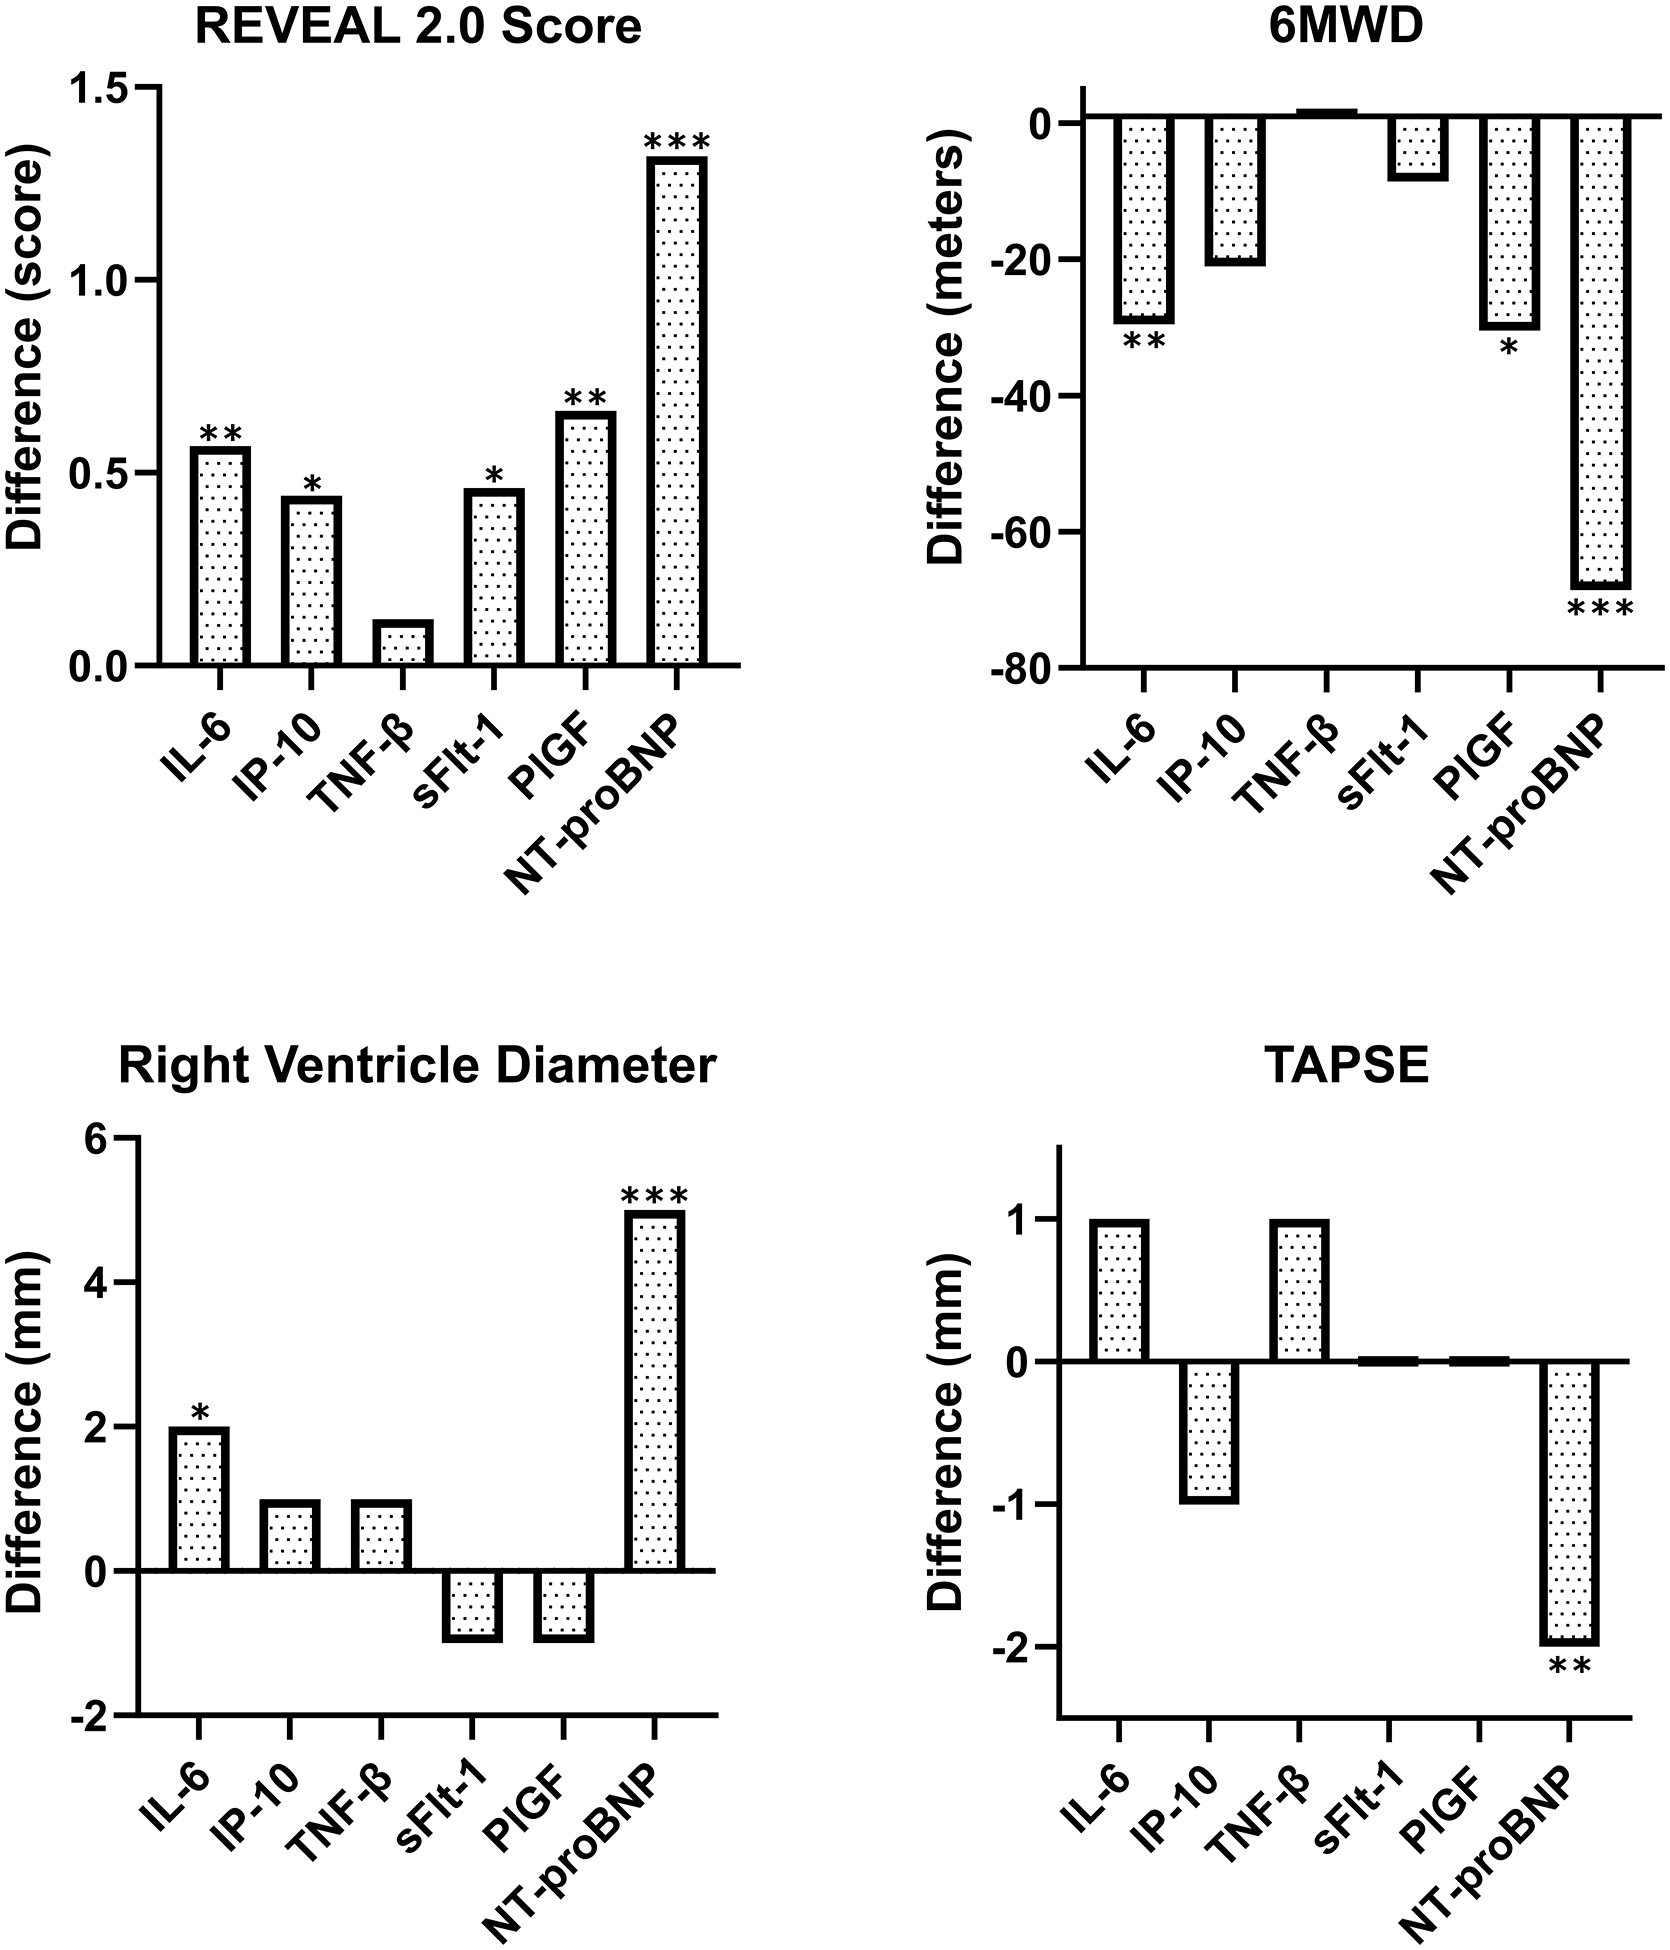
Figure 4: Biomarker associations with echocardiographic and clinical outcomes.

Linear regression models were run on biomarker associations with REVEAL 2.0 score, right ventricle (RV) diameter, tricuspid annular plane systolic excursion (TAPSE), and 6-minute walk distance (6MWD). Models were adjusted for age, sex, etiology, and height. Graphs display the difference in REVEAL score, RV diameter, TAPSE, or 6MWD associated with a standard deviation change in biomarker concentration (* p≤0.05; ** p≤0.01; *** p≤0.001).
