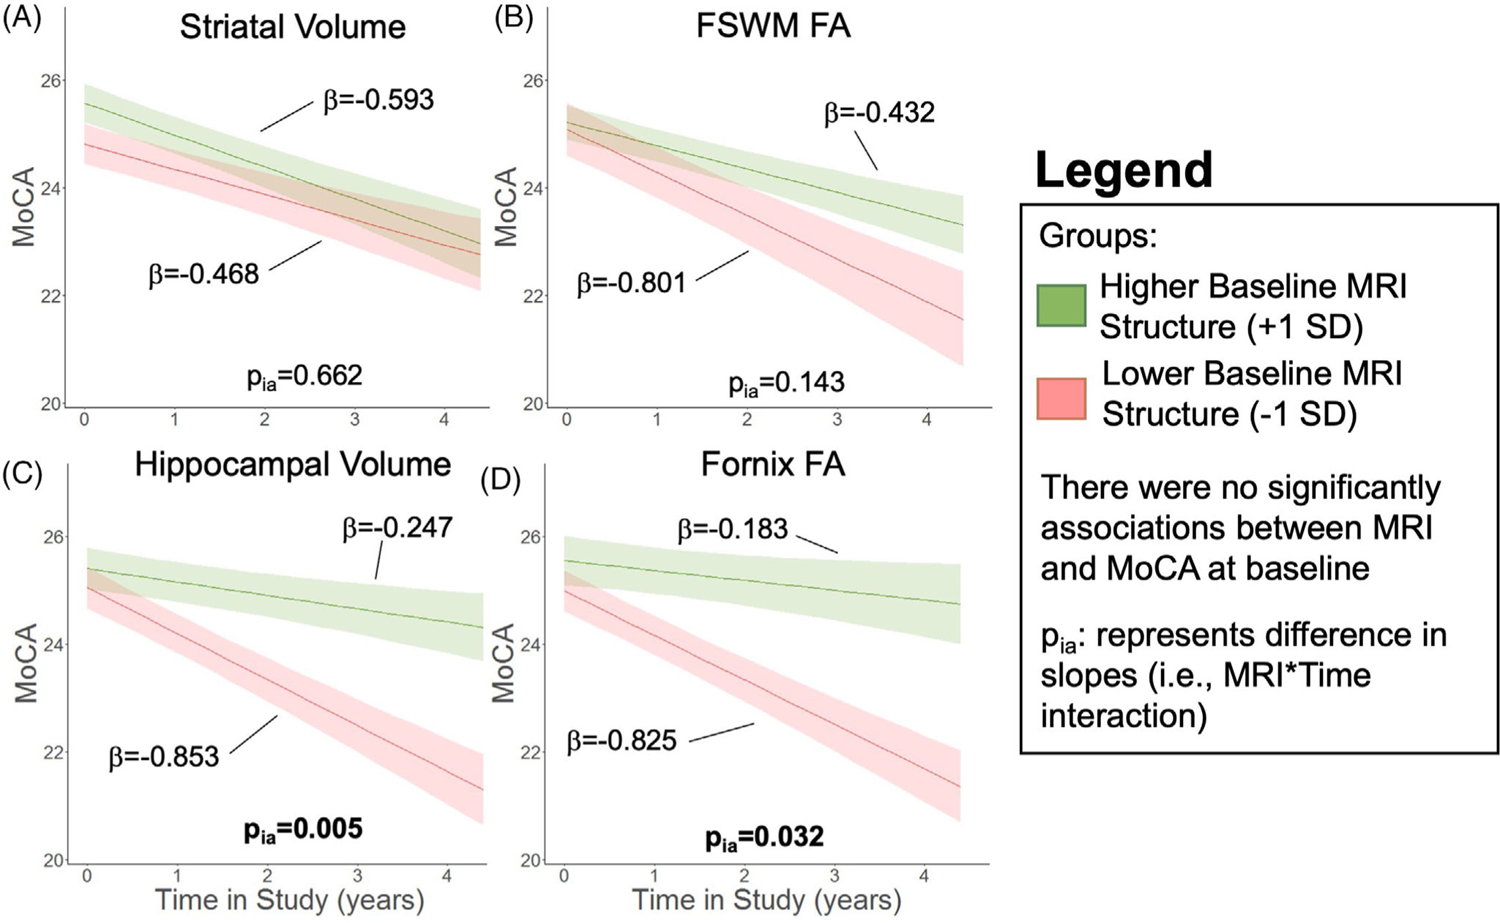
FIGURE 6.

Relation of baseline alterations with total MoCA trajectory. Cognitive trajectory in Parkinson’s disease (PD) participants measured with total Montreal Cognitive Assessment (MoCA) based on baseline MRI metrics of (A) striatal volume, (B) frontostriatal white matter (FSWM) fractional anisotropy (FA), (C) hippocampal volume, and (D) fornix FA. The bold lines represent the expected trajectory for a 65-year-old woman at 4 years disease duration with a baseline metric 1 standard deviation (SD) above the sample mean (green) and 1 SD below the sample mean (red). The low/high value for each metric is 6748/8098 mm2 for striatum, 0.37/0.42 for FSWM FA, 3692/4370 mm3 for hippocampal volume, and 0.26/0.29 for fornix FA. Shading represents the standard error of the mean of the outcome variable. Total MoCA was the outcome variable. Baseline age, baseline disease duration, sex, baseline MRI metric, study time, and the study time × baseline MRI interaction term were the fixed effects. Intercept and slope were the random effects for each PD participant. There were no associations between the MRI metric and MoCA at baseline. pia represents effect of baseline metric on slope of cognitive metric.
