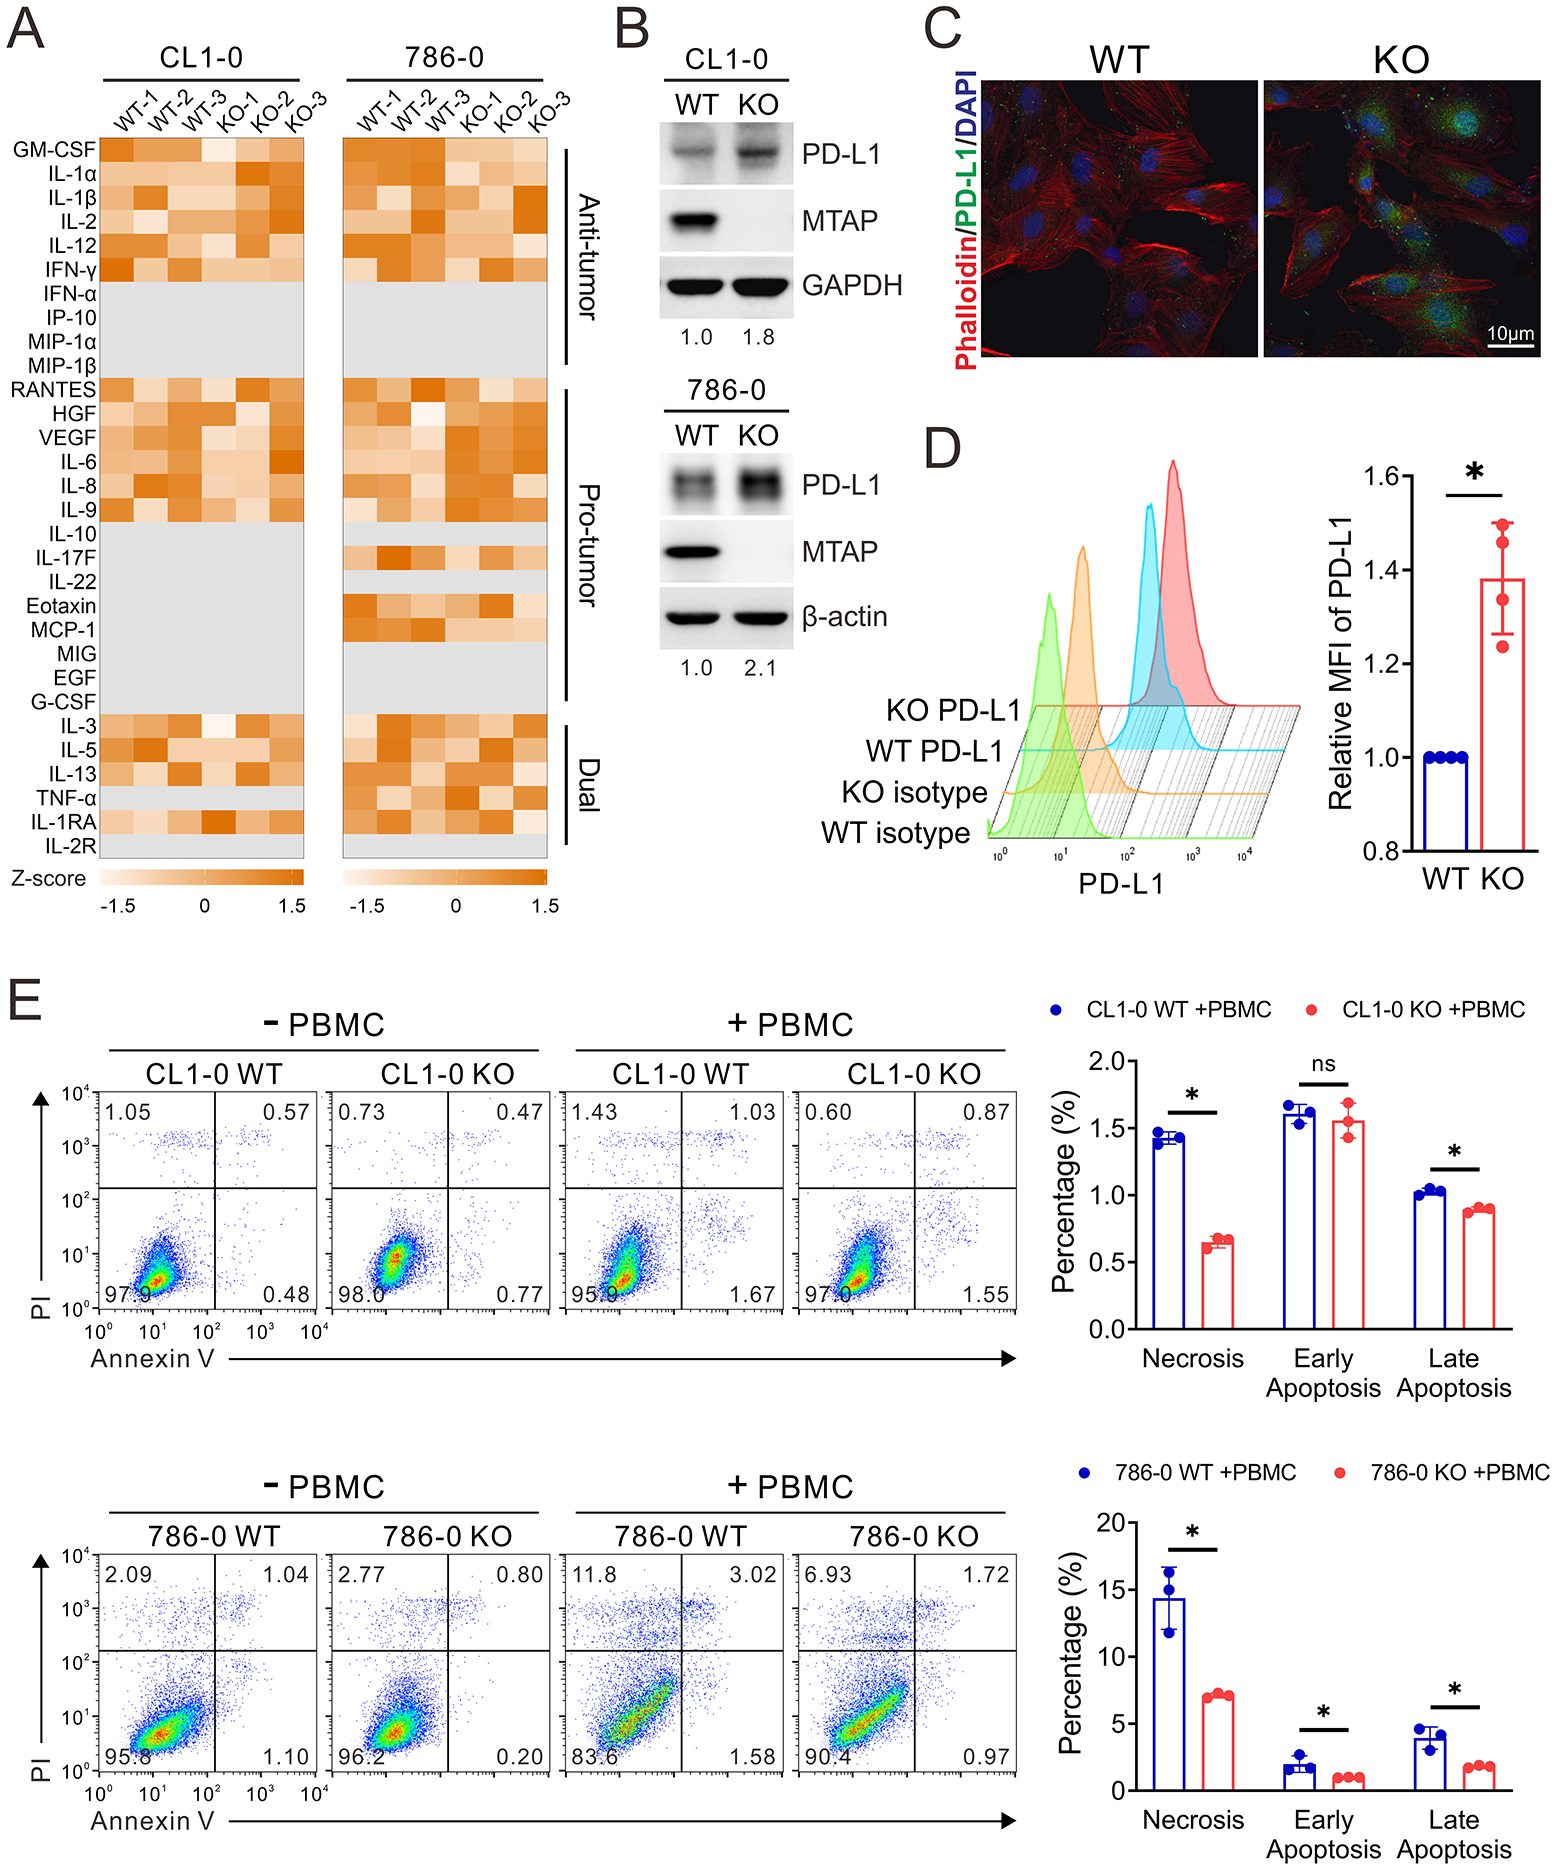
Figure 2. MTAP deficiency enhances tumor immunosuppressive effect.

(A) Analysis of cytokines secreted from MTAP-WT and MTAP-KO CL1-0 lung cancer and 786-O RCC cells by Luminex Multiplex Assays. The semiquantitative results of cytokine secretion levels were represented as heatmap graphs (n=3). Gray: below level of detection. (B) Western blot analysis of cellular PD-L1 expression levels in MTAP-WT and MTAP-KO CL1-0 and 786-O cells. The number indicates the quantification of three independent Western blots. (C) Representative immunofluorescent images of cellular PD-L1 expression levels in MTAP-WT and MTAP-KO 786-O RCC cells. (D) Flow cytometric analysis comparing cell surface PD-L1 levels between MTAP-WT and MTAP-KO 786-O cells. The mean fluorescence intensity (MFI) of PD-L1 in each cell population was quantified by FlowJo. Isotype: isotype negative control. (E) The viability of MTAP-WT and MTAP-KO CL1-0 and 786-O cells after being co-cultured with PBMCs for 48 hours. Data are presented as mean ± SD (n=3). *, p < 0.05.
