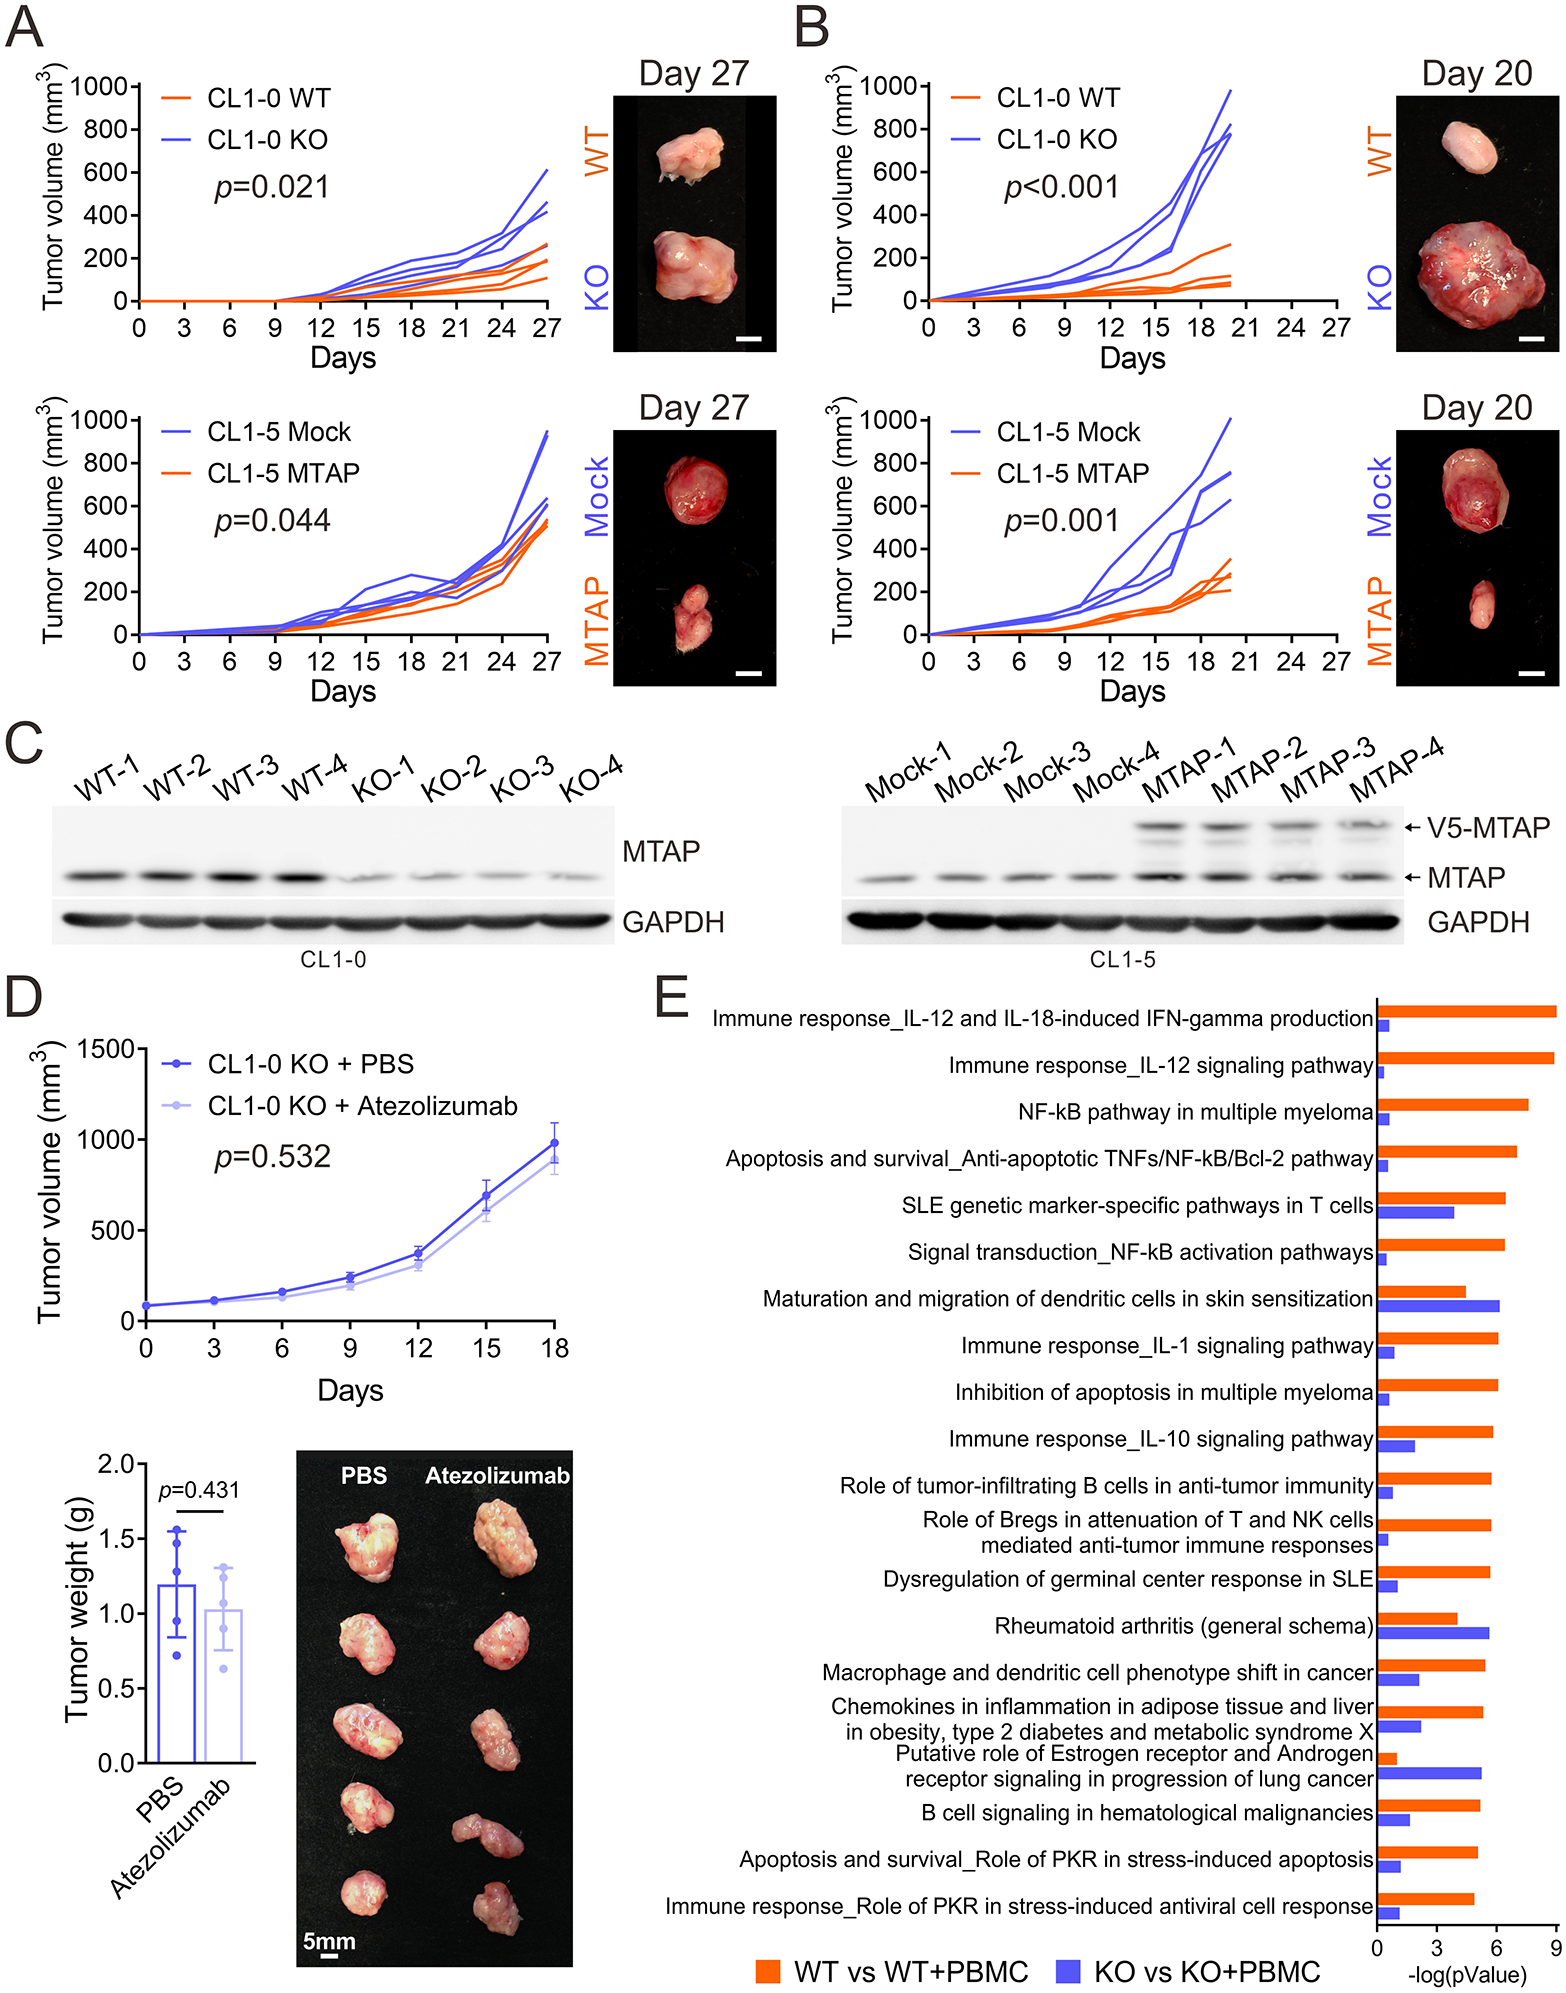
Figure 3. MTAP deficiency promotes tumorigenesis and immune dysfunction.

(A, B) Tumor growth of subcutaneously injected MTAP-WT and MTAP-KO CL1-0 and Mock and MTAP-expressing CL1-5 lung cancer cells in NSG-SGM3 humanized mice engrafted without (A) or with (B) human hematopoietic stem cells was measured every three or two days and dissected at Day 27 or 20 (four mice per group). Scale bars: 5 mm. (C) MTAP protein expression levels in tumors isolated from NSG-SGM3 humanized mice were assessed by Western blot assays. (D) Human CD34+ hematopoietic stem cell-engrafted NSG-SGM3 mice bearing subcutaneous tumors derived from MTAP-KO CL1-0 lung cancer cells were treated for 21 days with intraperitoneal injections of PBS or atezolizumab, an anti-PD-L1 antibody. Tumor volumes were measured and data was presented as mean ± SD (n=5, top). Tumor weights (bottom, left) and a representative photo of primary tumors (bottom, right) were shown (n=5, mean ± SE). (E) Top 20 ranking pathways enriched by the 279 genes (orange bars) and 234 genes (purple bars) from the differentially expressed genes (DEGs) with greater or equal to 2-fold change subjected to pathway analysis by the MetaCore analytical suite, as described in Supplementary Figure S3B. The pathway order was ranked by the -log(pValue) of orange bars.
