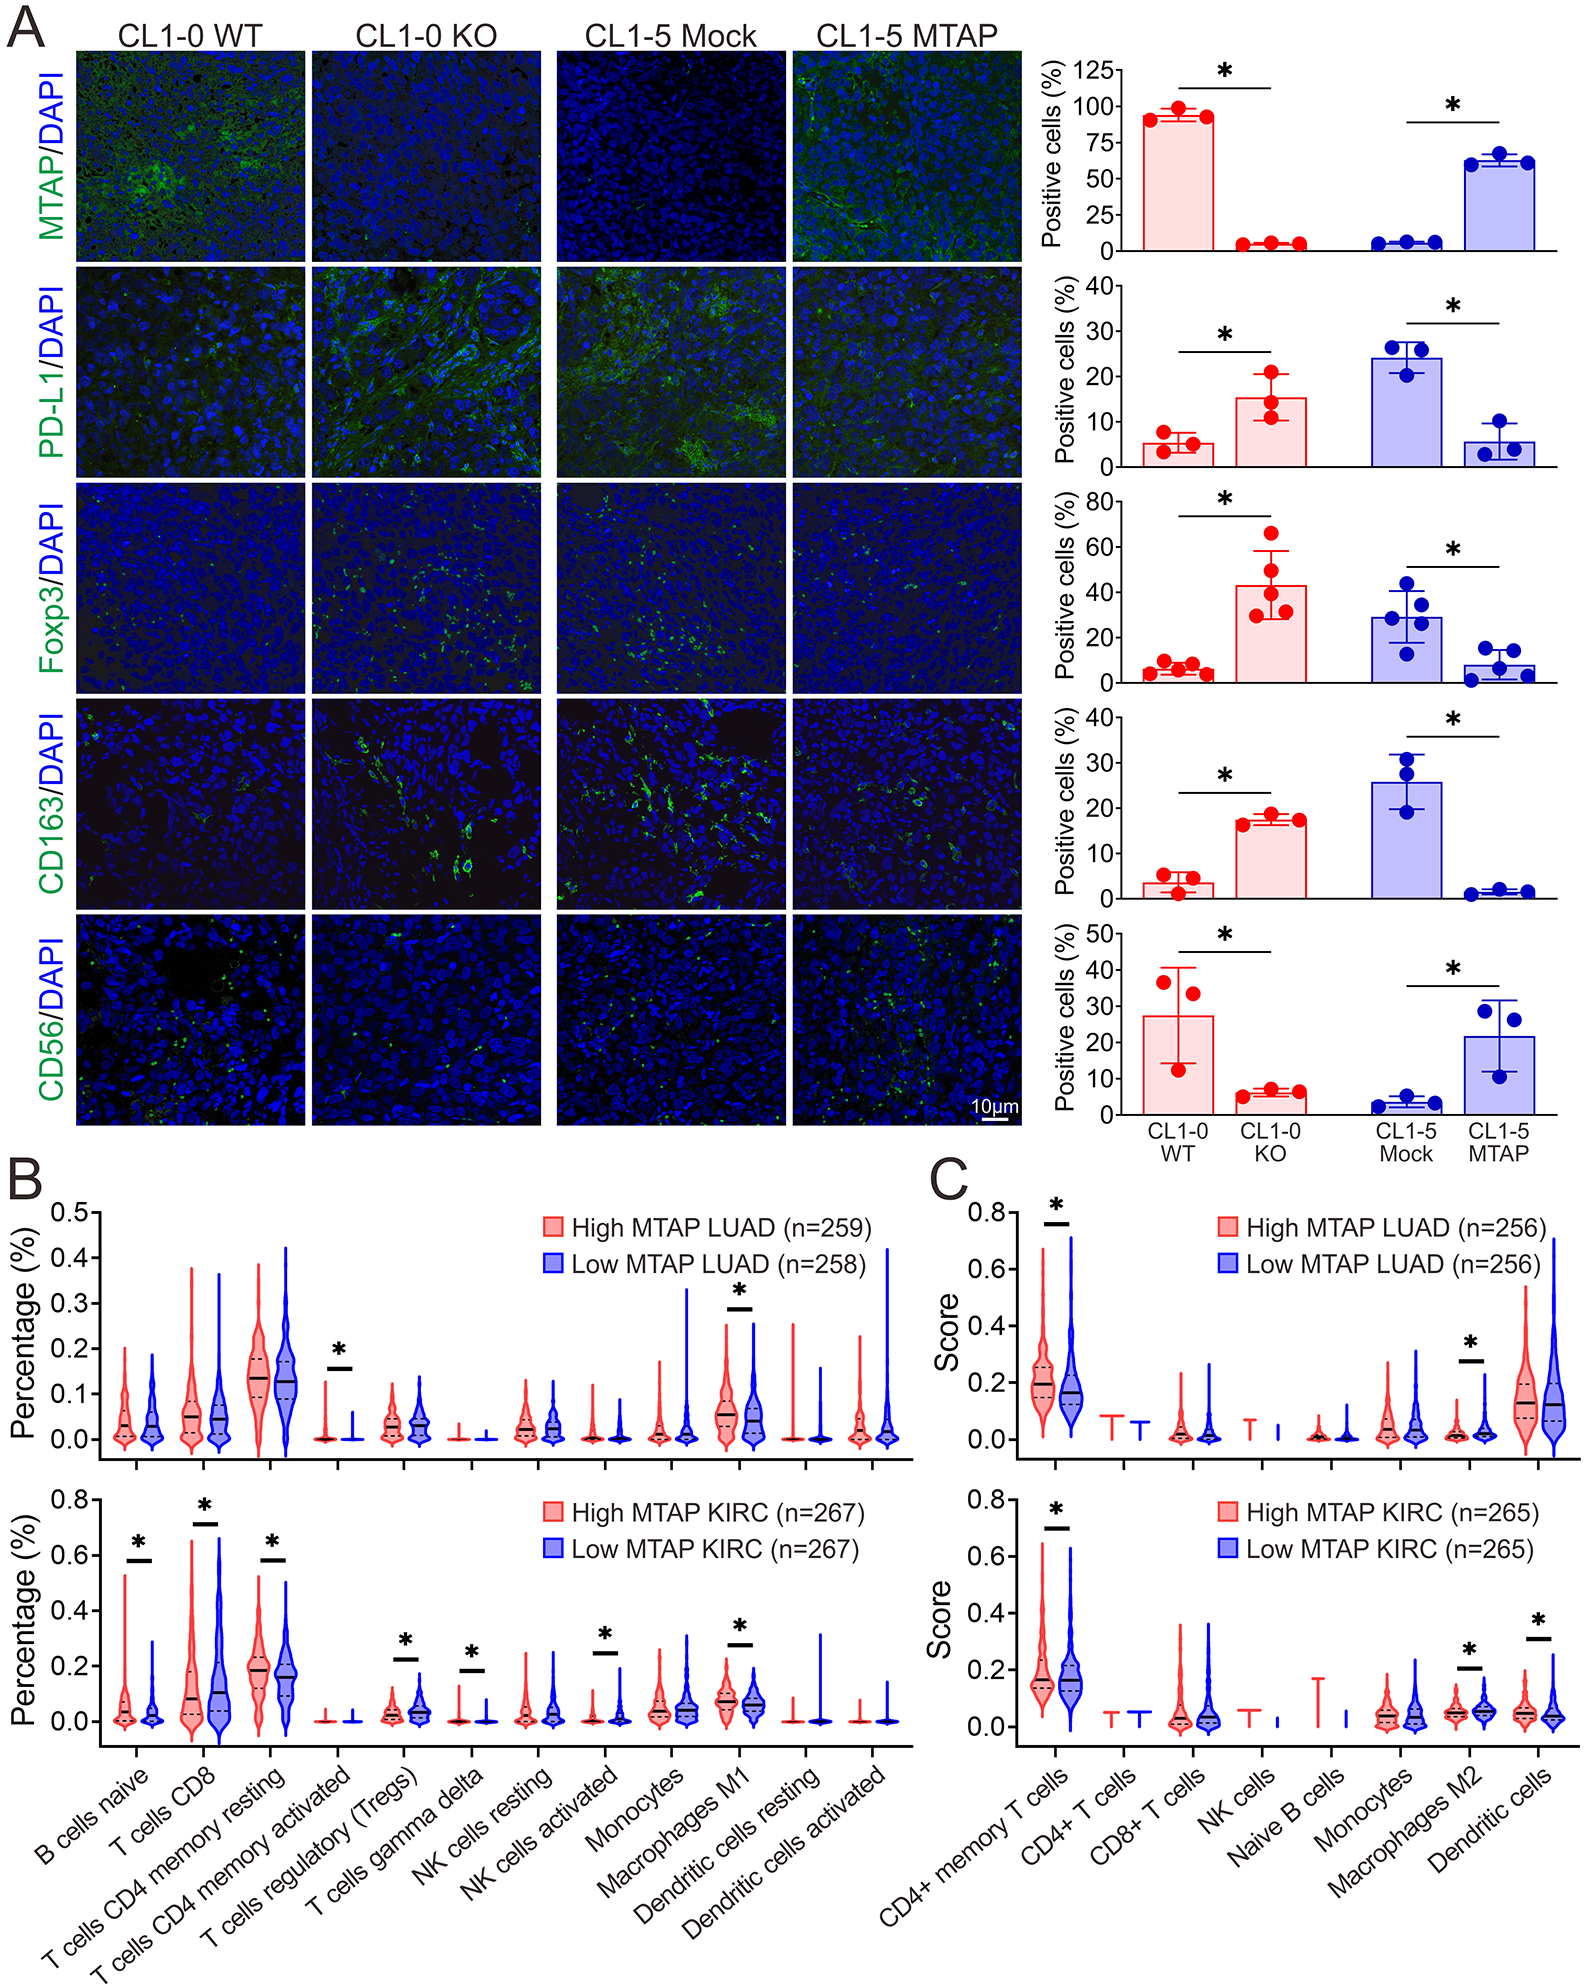
Figure 6. Comparison of immune cell populations between MTAP-expressing and MTAP-deficient tumors.

(A) Representative immunofluorescent images of the protein expression patterns of MTAP, T cell exhaustion marker PD-L1, Treg cell marker Foxp3, M2-subtype macrophage marker CD163 and NK cell marker CD56 in tumors from humanized mice. Right: quantification of the positive-stained cells within tumors. Data are from each tumor of humanized mice and shown as mean ± SD. *, p < 0.05. (B, C) Estimated proportion of immune subpopulations in lung adenocarcinoma (LUAD) and kidney renal clear cell carcinoma (KIRC) patients with high or low MTAP mRNA expression from The Cancer Genome Atlas Program was analyzed by computational deconvolution of transcriptomics data using Cibersort (B) and xCell (C). *, p < 0.05.
