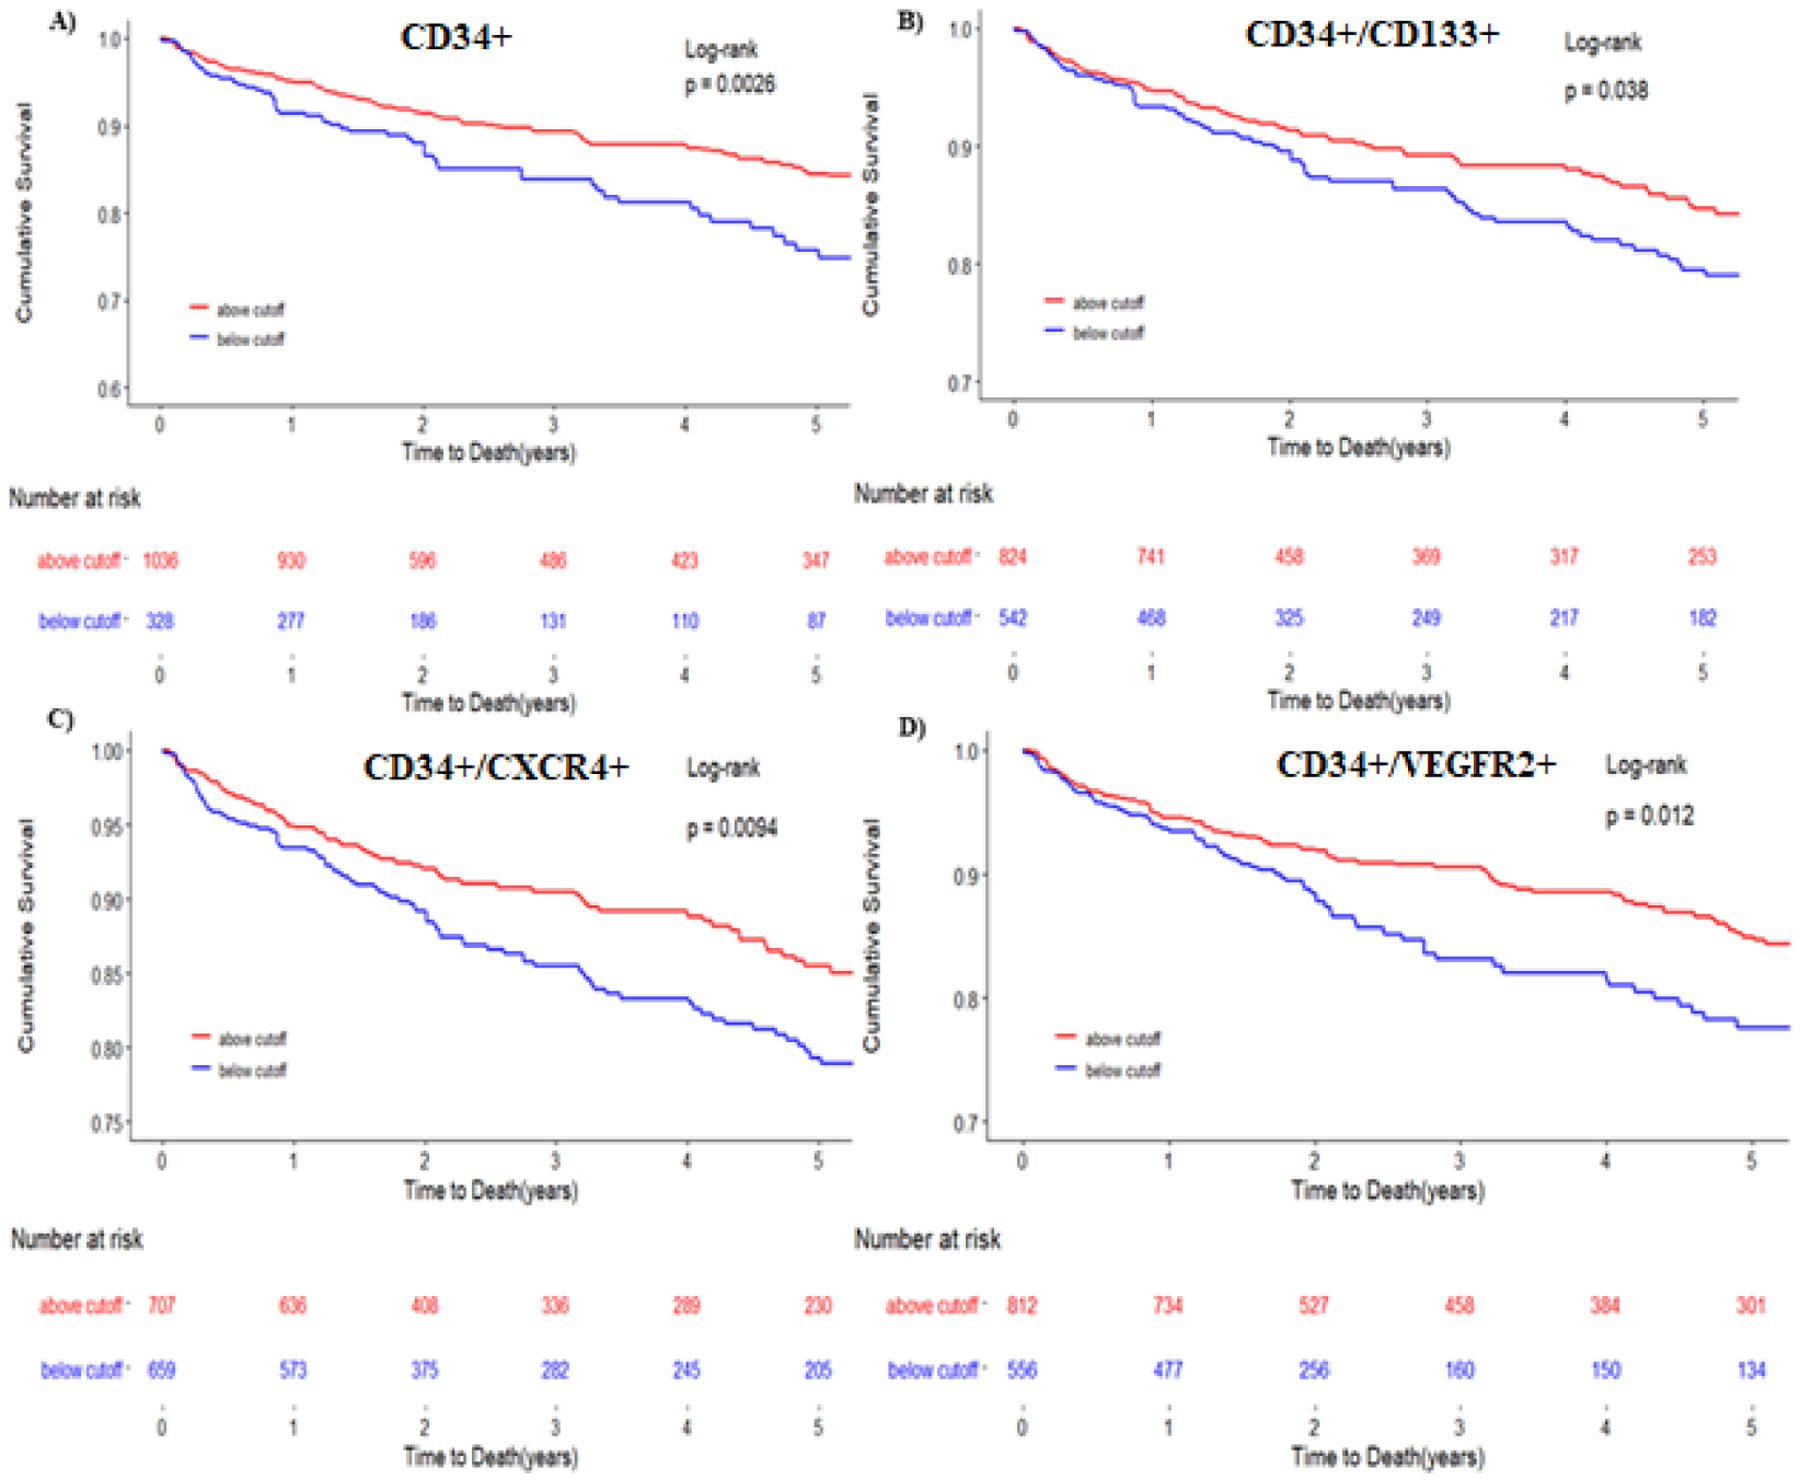
Figure 2: Kaplan-Meier survival curves for cardiovascular death/MI using ROC cutoff.

Kaplan-Meier survival curves for the composite end point of cardiovascular death/MI for CD34+ (A), CD34+/CD133+ (B), CD34+/CXCR4+ (C), CD34+/VEGFR2+ (D). The blue line represents cells below the ROC derived cutoff. The red line represents progenitor cell levels below the ROC derived cutoff. Cutoffs used were 1032 cells/milliliter for CD34+ cells, 625 cells/milliliter for CD34+/CD133+ cells, 25 cells/milliliter for CD34+/VEGF2R+ cells and 794 cells/milliliter for CD34+/CXCR+ cells.
