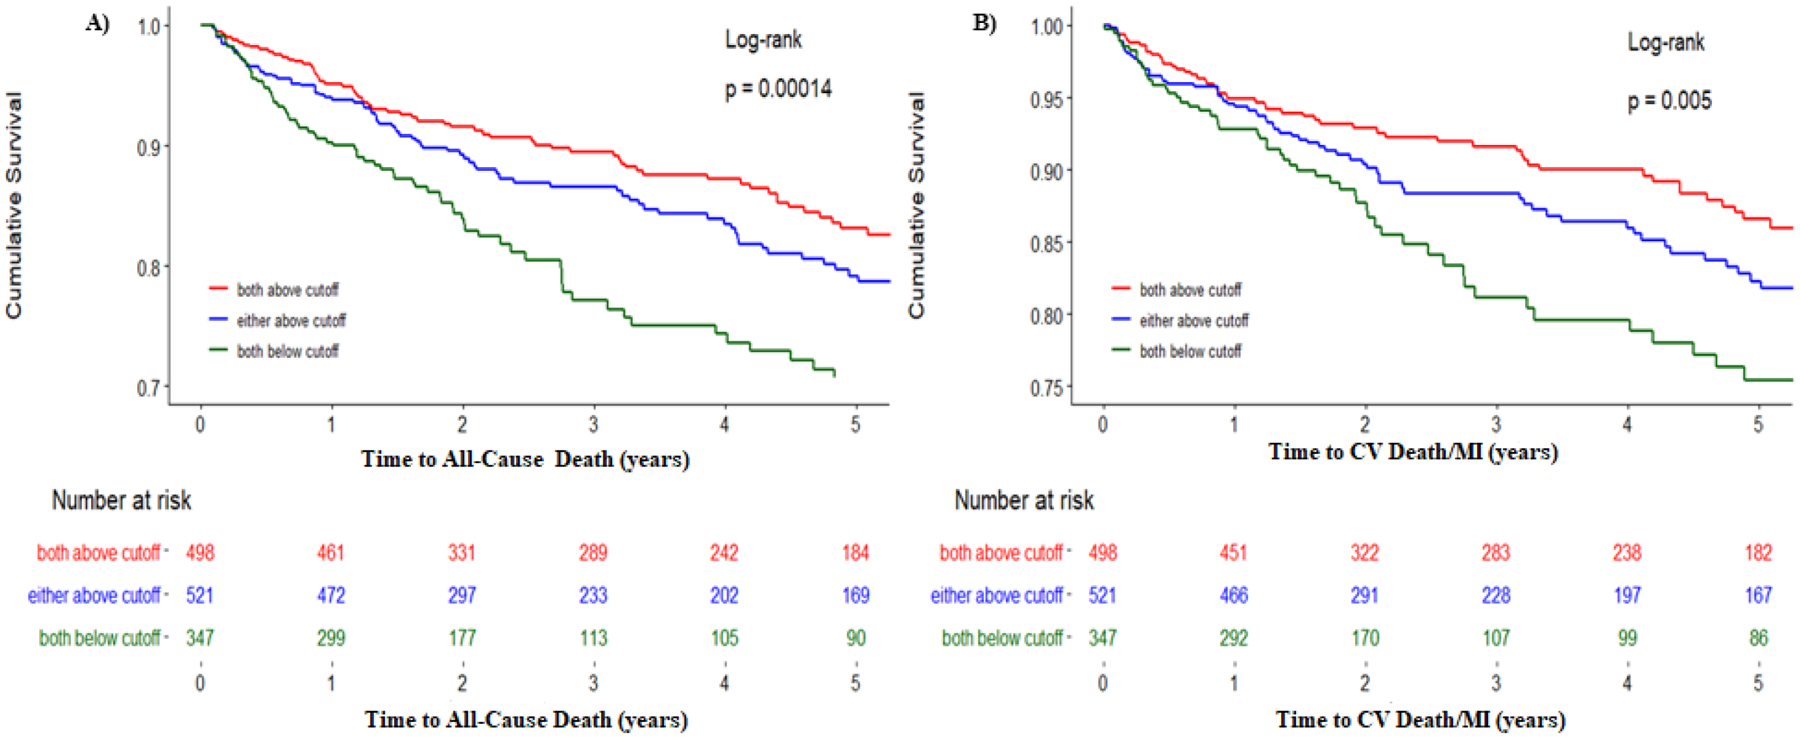
Figure 3: Adjusted survival curves for all-cause death and cardiovascular death/MI.

Kaplan-Meier survival curves for the primary end point of A) death, B) composite of cardiovascular death and myocardial infarction (MI) stratified by Progenitor Cell Score. The green line represents a Progenitor Cell Score of 2, indicating both CD34+/CXCR4+ and CD34+/VEGFR2+ cells are below the ROC-derived cutoff. Blue line represents progenitor cell score of 1, indicating either CD34+/CXCR4+ or CD34+/VEGFR2+ are below the ROC-derived cutoff. The red line represents progenitor cell score of 0, with both CD34+/CXCR4+ cells and CD34+/VEGF2R+ cells above the ROC-derived cutoff. Cutoffs used were 25 cells/milliliter for CD34+/VEGFR2+ cells and 794 cells/milliliter for CD34+/CXCR+ cells (see Methods section of this article)
