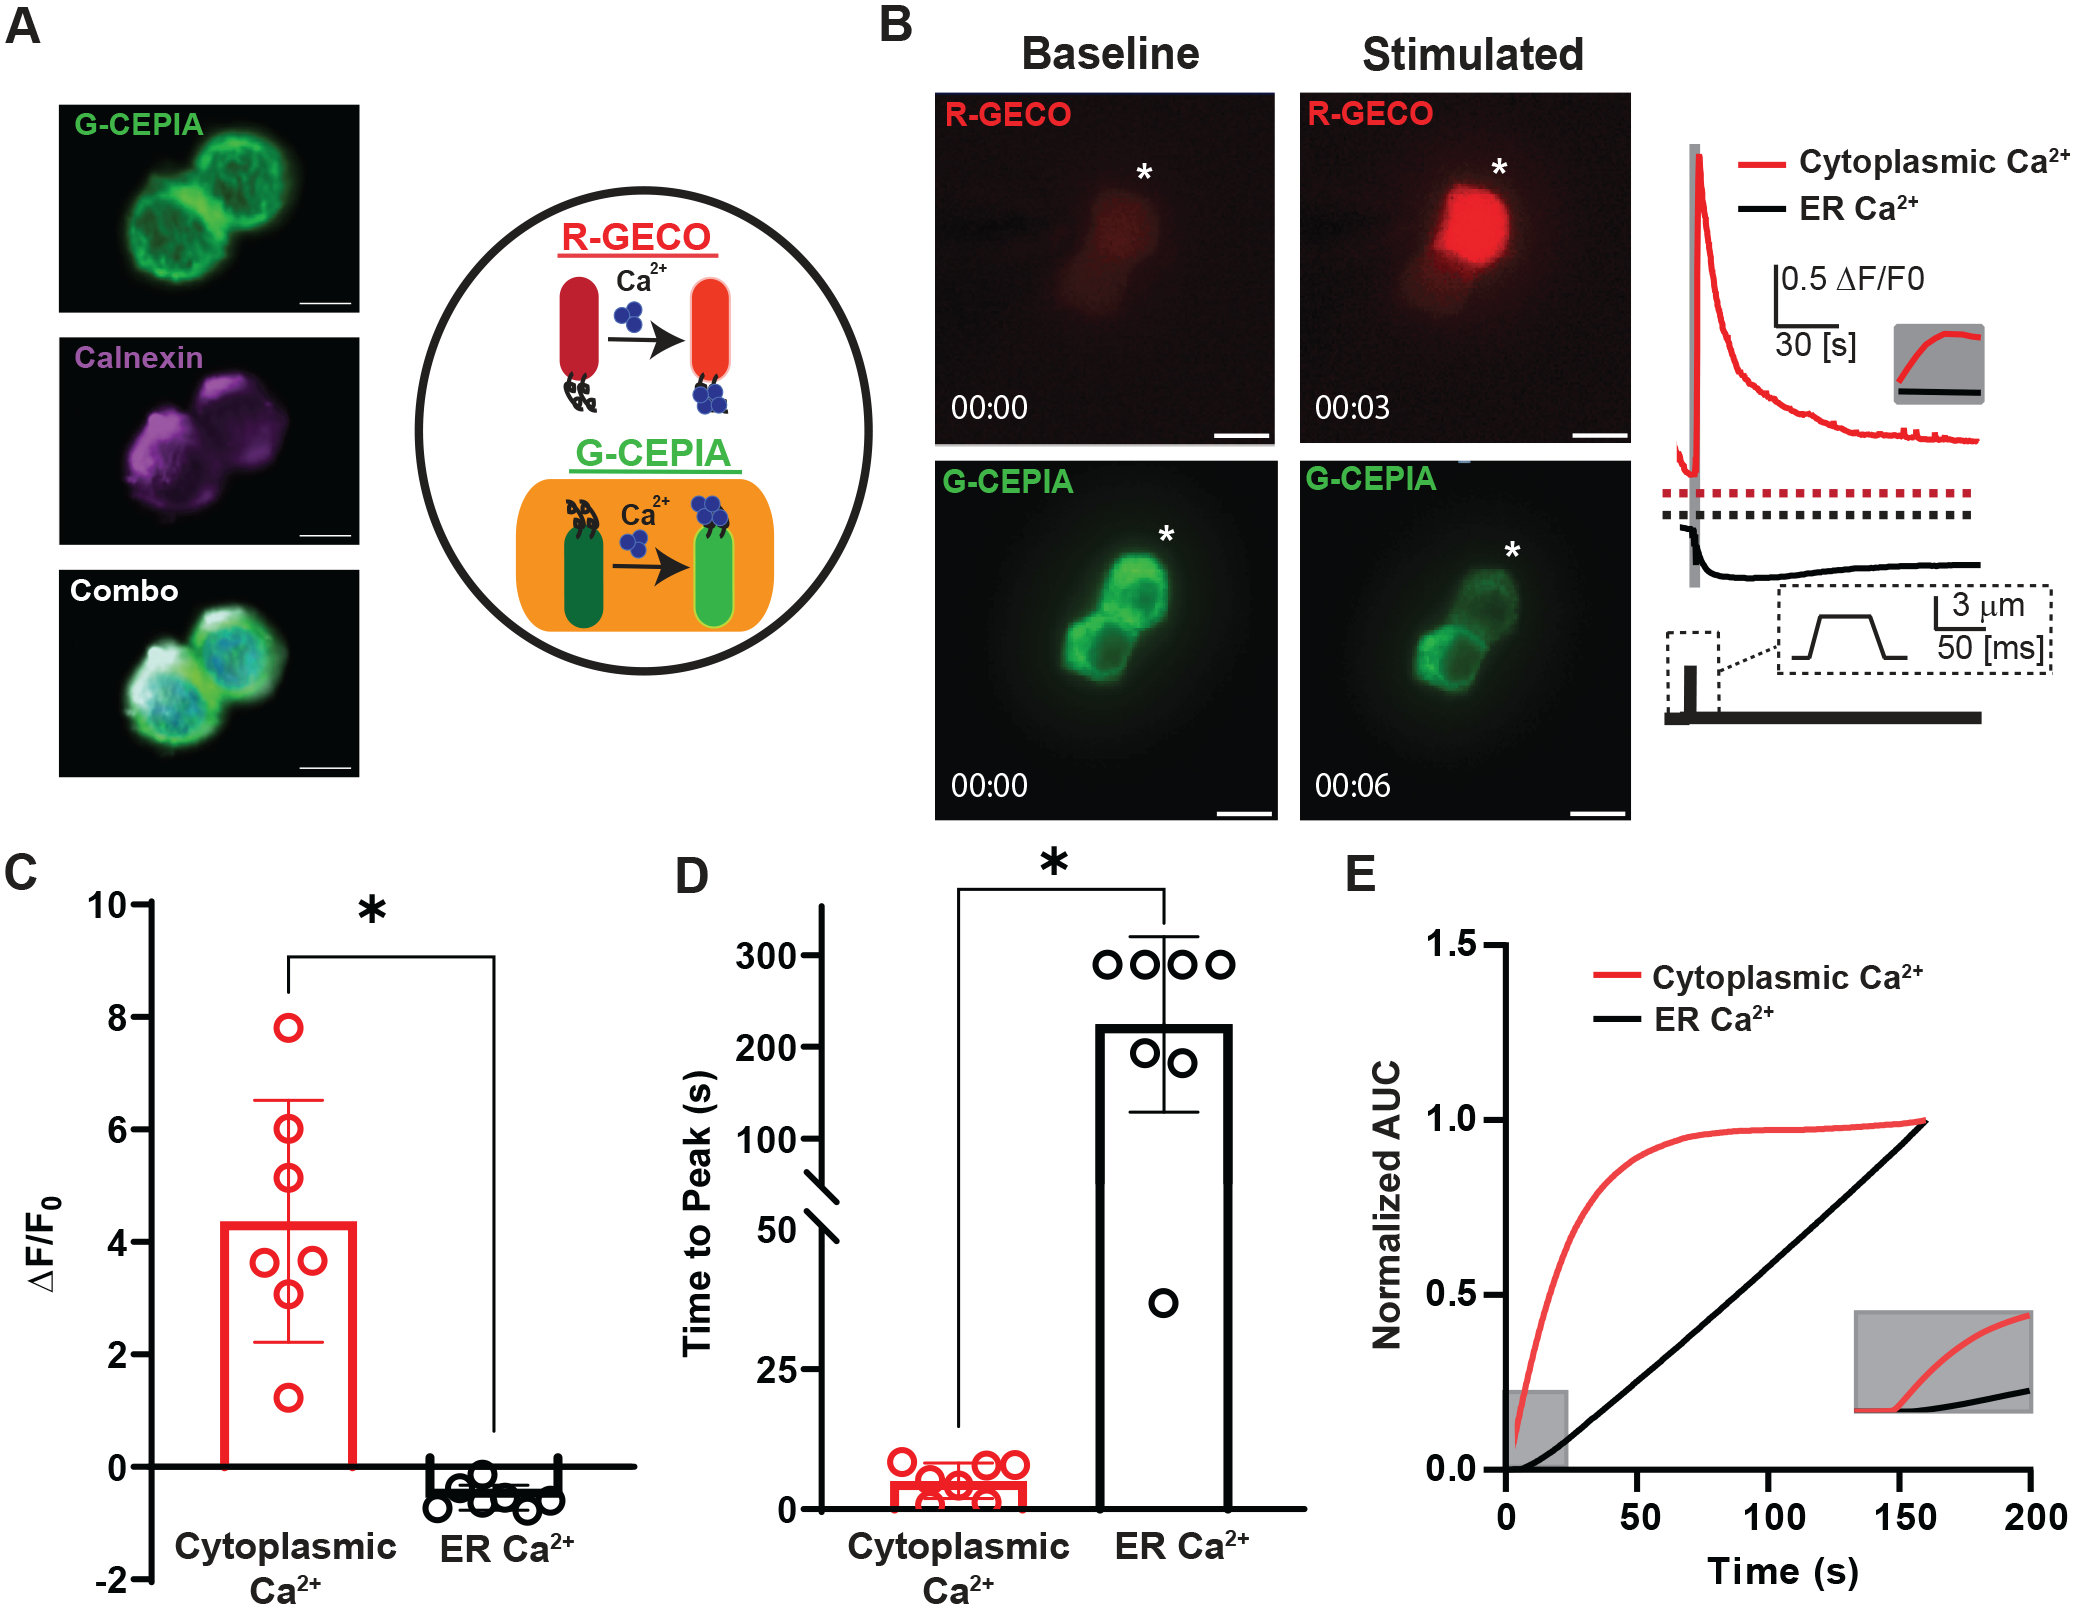
Figure 1. EEC cell model (QGP-1) responds to mechanical stimulation with a rapid increase in cytoplasmic Ca2+ and concurrent slower decrease in ER Ca2+.

A) Left panel shows confocal images of QGP-1 cell transfected with G-CEPIA (green), stained with Calnexin (magenta), and combined together with Dapi (blue) to show partial overlap G-CEPIA to ER stores [Scale bar: 10 μm]. Right panel depicts a cartoon showing experimental design of a cell with dual genetically encoded Ca2+ indicators in the cytoplasm (R-GECO, red) and the ER (G-CEPIA, green) for concurrent Ca2+ reporting.
B) Left panel shows two QGP-1 cells transfected with R-GECO (red) and G-CEPIA (green) prior to mechanical stimulation by 50 ms pulse of 3 um membrane displacement. Post-stimulation images taken 3 or 6 seconds following displacement. * denotes cell being displaced. [Scale bar: 10 μm]. Right panel shows representative fluorescence responses (ΔF/F0) of mechanically stimulated QGP-1 cell in R-GECO (cytoplasmic Ca2+, red) and G-CEPIA (ER Ca2+, black). Grey bar and inset show the rapid increase in cytoplasmic Ca2+.
C) Individual (circles) and mean ± SD (bars) data for peak fluorescence responses reported increase in cytoplasmic Ca2+ (red, ΔF/F0 = 4.4±2.2, n=7) and decrease in ER Ca2+ (black, ΔF/F0 = −0.54±0.22, n=7)(*P=0.0011, paired t test)
D) Individual (circles) and mean ± SD (bars) data for time to peak for cytoplasmic Ca2+ (red, ΔF/F0 = 5.1±3.2 s, n=7) and ER Ca2+ (black, ΔF/F0 = 220±96 s, n=7)(*P<0.0001, paired t test)
E) Normalized area under the curve (AUC) showing kinetics of Ca2+ changes in the stores and the cytoplasm. The compartments are functioning under different time scales. Grey inset showing first 25 seconds after membrane displacement.
