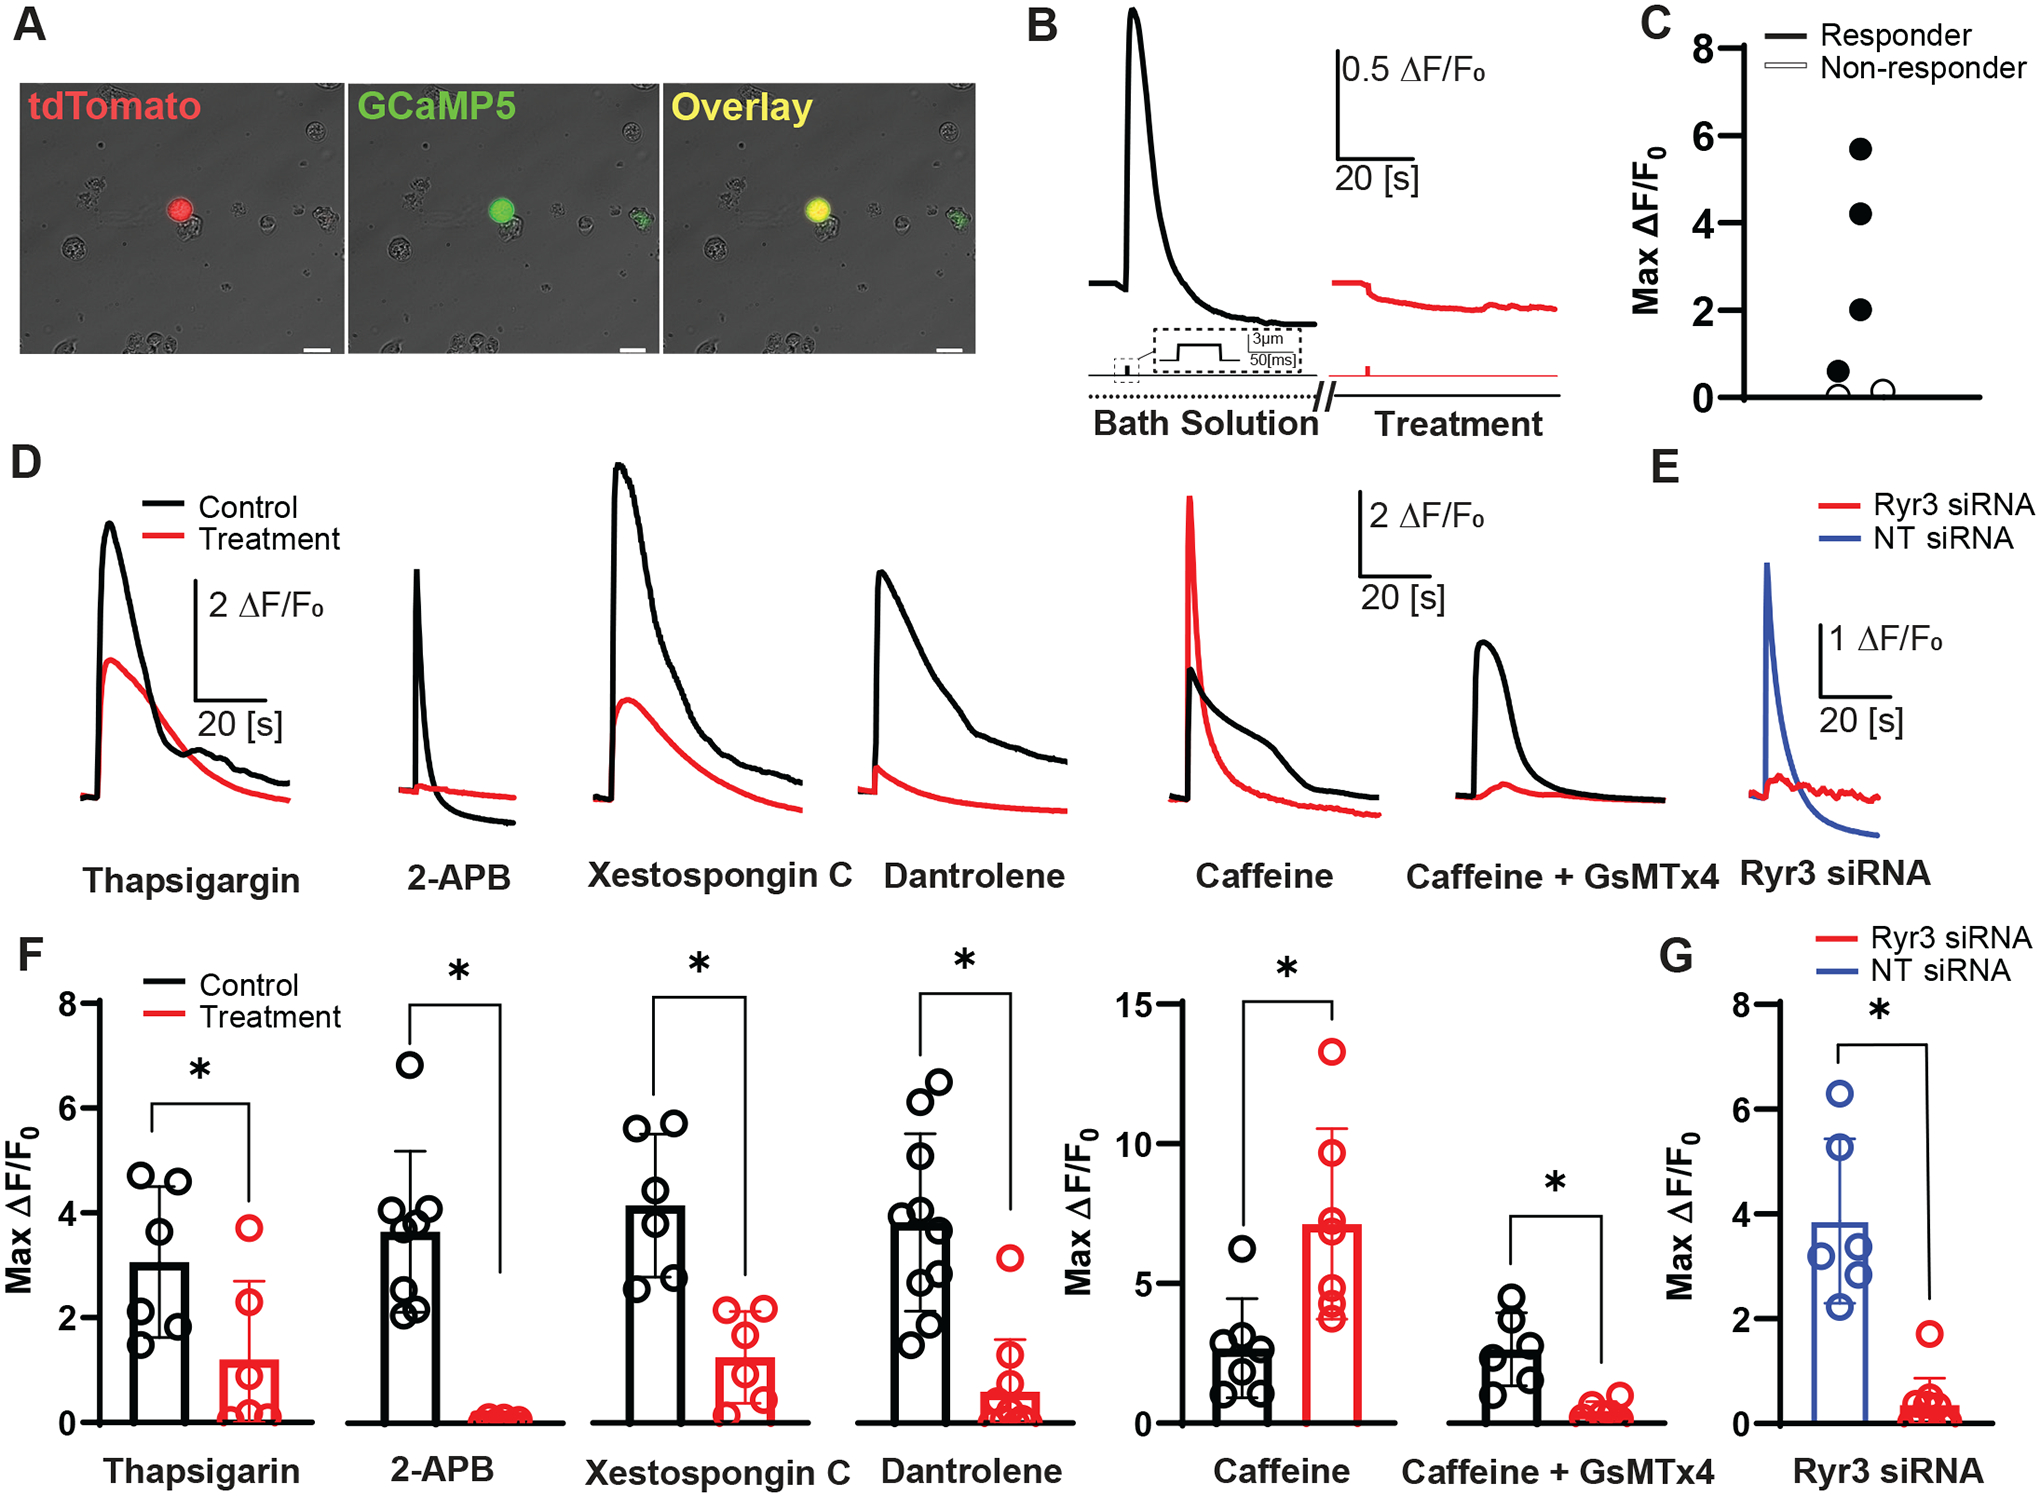
Figure 3. Mechanically induced primary EEC intracellular Ca2+ changes are modified by an agonist and blockers of intracellular Ca2+ receptors.

A) Images of a primary colonic EEC culture dissociated from a NeuroD1-GCaMP5 mouse. EECs from model express both tdTomato (red) and GCaMP5 (green) in same cell (yellow). [Scale bar: 20 μm].
B) Representative traces of mechanically induced intracellular calcium changes (ΔF/F0) before (black) and during treatment (red) with a putative intracellular Ca2+ receptor blocker [Scale bar: 0.5 ΔF/F0, 20 s]. Corresponding mechanical stimulation period shown in the line below trace [Scale bar: 3 μm, 50 ms]. Bath solution or treatment duration is depicted in line under mechanical stimulation. Double slashed lines represent gaps in timeline depicting a drug incubation (5–10 min).
C) Peak intracellular calcium responses (ΔF/F0) of individual cells (circles) depicting typical range of responsive (black filled) and non-responsive (open) EECs after mechanical stimulation during calcium imaging. 4/6 cells qualified as responsive to mechanical stimulation (ΔF/F0 ≥ 0.5).
D) Representative traces of GCaMP5 fluorescence changes showing paired primary EEC responses to a single brief mechanical stimulation by membrane displacement (3 μm, 50 ms duration) for control (black), with pharmacologic modulators (red): 10 μM thapsigargin, 50 μM 2-APB, 5 μM Xestospongin C, 10 μM dantrolene, 2 mM caffeine or 10 μM GsMTx4. [Scale bars: 2ΔF/F0, 20 s]
E) Representative traces of EECs mechanically stimulated after transfection with 20 nM RyR3 siRNA (red), or 20 nM non-target (NT) siRNA (blue). [Scale bars: 1ΔF/F0, 20 s]
F) Peak intracellular calcium responses (ΔF/F0) of individual cells (circles) and mean ± SD (bars) showing primary EEC intracellular Ca2+ changes in response to mechanical stimulation (3 μm, 50 ms duration) during paired experiments with: Thapsigargin (ΔF/F0 = 3.1±1.4 vs. 1.2±1.5, n=6 cells)(*P=0.0379, paired t test), 2-APB (ΔF/F0 = 3.7±1.5 vs. 0.48±0.81, n=8 cells)(*P=0.0035, paired t test), Xestospongin C (ΔF/F0 = 4.2±1.4 vs. 1.4±0.88, n=6 cells)(*P=0.0096, paired t test), Dantrolene (ΔF/F0 = 3.8±1.7 vs. 0.60±0.99, n=10 cells)(*P<0.0001, paired t test), Caffeine (ΔF/F0 = 2.7±1.8 vs. 7.1±3.4, n=7 cells)(*P=0.0276, paired t test), and Caffeine with GsMTx4 (ΔF/F0 = 2.6±1.3 vs. 0.45±0.32, n=6 cells)(*P=0.0079, paired t test). Asterisk (*) used to denote P <0.05.
G) Peak intracellular calcium responses (ΔF/F0) of individual cells (circles) and mean ± SD (bars) showing primary EEC intracellular Ca2+ changes in response to mechanical stimulation (3 μm, 50 ms duration) after RyR3 siRNA and NT siRNA (ΔF/F0 = 3.9±1.6 (NT) vs. 0.35±0.51 (Ryr3 siRNA), n=6 and 10 cells)(*P<0.0001, unpaired t test). Asterisk (*) used to denote P <0.05.
