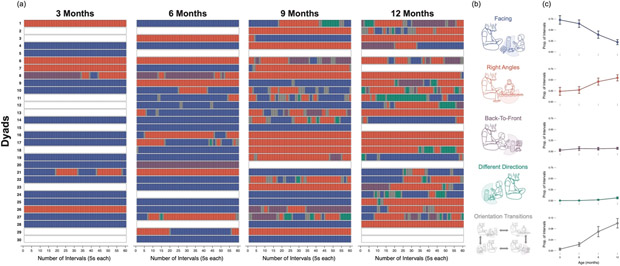
Figure 4.
Data on dyadic positioning across the first year of life. The raster plot in panel (a) presents individual timelines for each mother-infant dyad’s co-orientations across sixty, 5-second intervals spanning a total of five minutes of play. The data represent both the real-time fluctuations of dyadic co-orientation between each 5-second interval within a session and change in patterns of orientations across sessions. Each row displays data from a single dyad’s sessions, and the white bars represent missing sessions. Orientations for each interval are color-coded, and the line drawings in panel (b) serve as a legend. Each color represents an orientation: blue = facing; orange = right angles; purple = back-to-front; green = different directions; and grey = transitions between orientations. Panel (c) highlights patterns of longitudinal change with proportional data for each orientation type. Error bars show standard errors.

