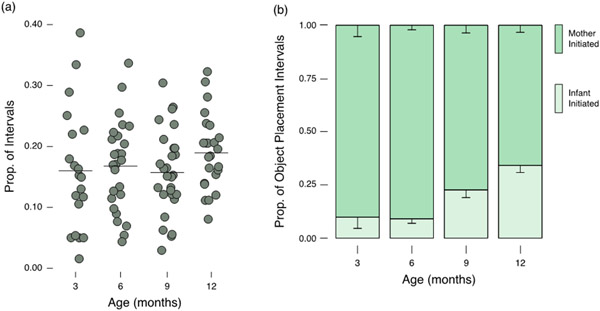
Figure 7.
Data on object placement behaviors. Panel (a) shows the proportion of intervals containing a placement (regardless of initiator). Symbols represent individual data for each dyad and horizontal lines describe group means. Panel (b) presents proportional data on whether mothers (dark green bars) or infants (light green bars) initiated object placements. Error bars show standard errors.

