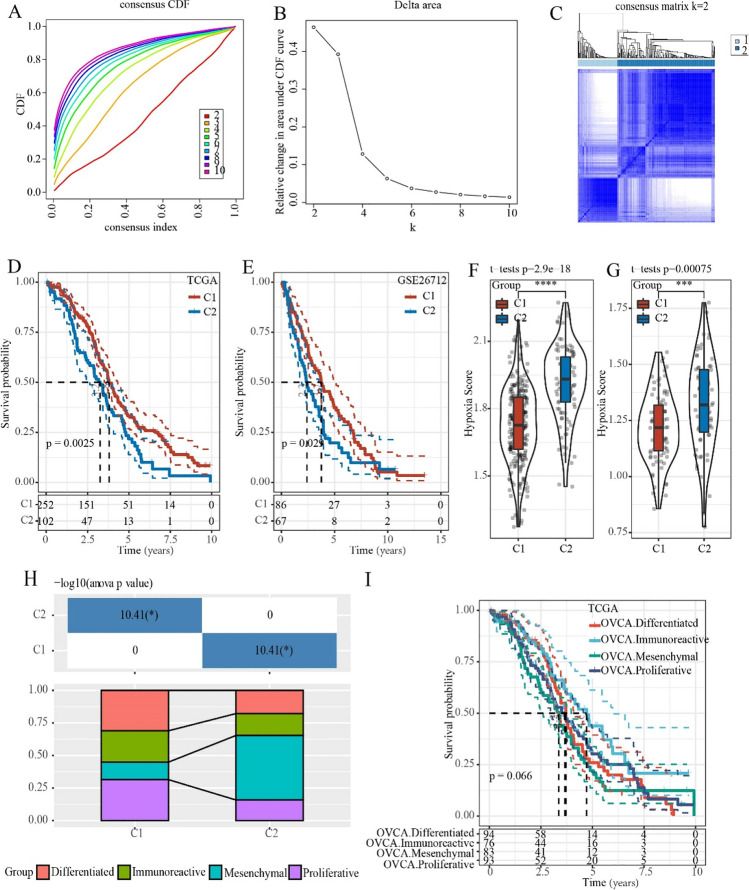
Fig. 1.
Identification of hypoxia-related ovarian cancer subtypes. A The cumulative distribution function (CDF) curve in TCGA cohort. B The CDF Delta area curve in TCGA cohort. C Heat map of sample clusters when consensus k = 2 in the TCGA cohort. D C1 had longer overall survival (OS) than that in C2 in the TCGA cohort. E C1 had a better survival outcome in the GSE cohort. F Differences in hypoxia scores among subtypes in the TCGA cohort. G Differences in hypoxia scores among subtypes in the GSE cohort. H Molecular subtype comparison information. I Survival curves of reported molecular subtypes. *p < 0.05, **p < 0.01, ***p < 0.001, ****p < 0.0001

