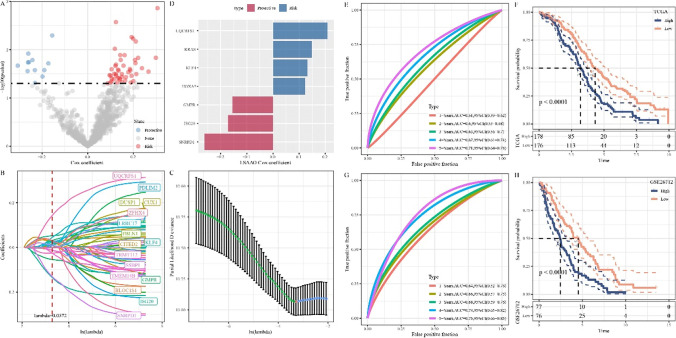
Fig. 4.
Establishment of a hypoxia-related risk scoring model. A Volcano plot showing candidate signature genes associated with OC prognosis. B Trajectories of candidate genes as lambda changes. C Confidence interval under lambda. D Distribution of LASSO coefficients of the hypoxia-related gene signature. E Receiver operating characteristic (ROC) curve of HYRS in TCGA cohort. F Survival curve of the high HYRS and low HYRS groups in TCGA cohort. G ROC curve of HYRS in GSE cohort. H Survival curve of the high HYRS and low HYRS groups in GSE cohort

