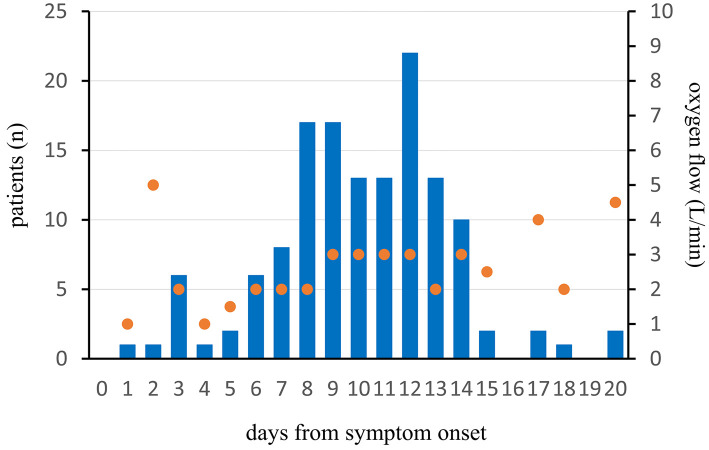
Figure 3.
Duration from symptom onset to the maximum supplemental oxygen and the mean of peak oxygen flow in 144 non-ICU patients. The blue bar represents the number of non-ICU patients, and the orange dot represents the mean of peak oxygen flow at that time. The day of symptom onset is defined as Day 0.

