Figure 6.
scd -/- males produce functionally mature sperm
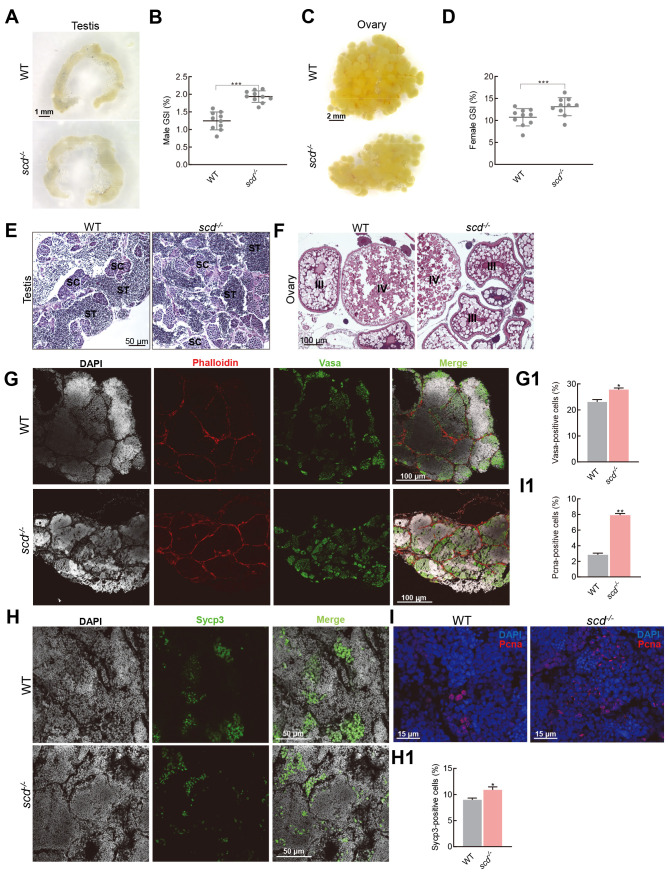
A: Morphological features of scd -/- gametes, size and shape of scd -/- male testis. Scale bars: 1 mm. B, D: GSI (gonad weight/body weight×100%) of males (B) and females (D) was significantly increased in scd -/- mutants compared to WT fish. GSI: Gonadosomatic index. C: Size and shape of scd -/- female ovary. Scale bars: 2 mm. E, F: H&E staining of testis (E) and ovary (F) sections from WT and scd -/- fish ( n=3, two sections for each sample) at 3 mpf. Scale bars: 50 μm (E), 100 μm (F). SC, spermatocyte; ST, spermatid. G: Immunofluorescence staining with Vasa antibody of WT and scd -/- testes at 3 mpf ( n=3, three sections for each sample). Scale bars: 100 μm. G1: Quantitative results of average area of Vasa-positive cells ( n=3, three sections for each sample). There were more germ cells in the scd -/- testis than in WT testis. H: Immunofluorescence staining with Sycp3 antibody of WT and scd -/- testes at 3 mpf ( n=3, three sections for each sample). Scale bars: 50 μm. H1: Quantitative results of average area of Sycp3-positive cells ( n=3, three sections for each sample). There were more meiotic cells in scd -/- testis than in WT testis. I: Immunofluorescence staining with Pcna antibody of WT and scd -/- testes at 3 mpf ( n=3, three sections for each sample). Scale bars: 15 μm. I1: Quantitative results of average area of Pcna-positive cells ( n=3, three sections for each sample). There were more mitotic cells in scd -/- testis than in WT testis. All values are mean± SEM. Student t-tests were used. *: P<0.05; **: P<0.01; ***: P<0.001.

