
Fig. 18.
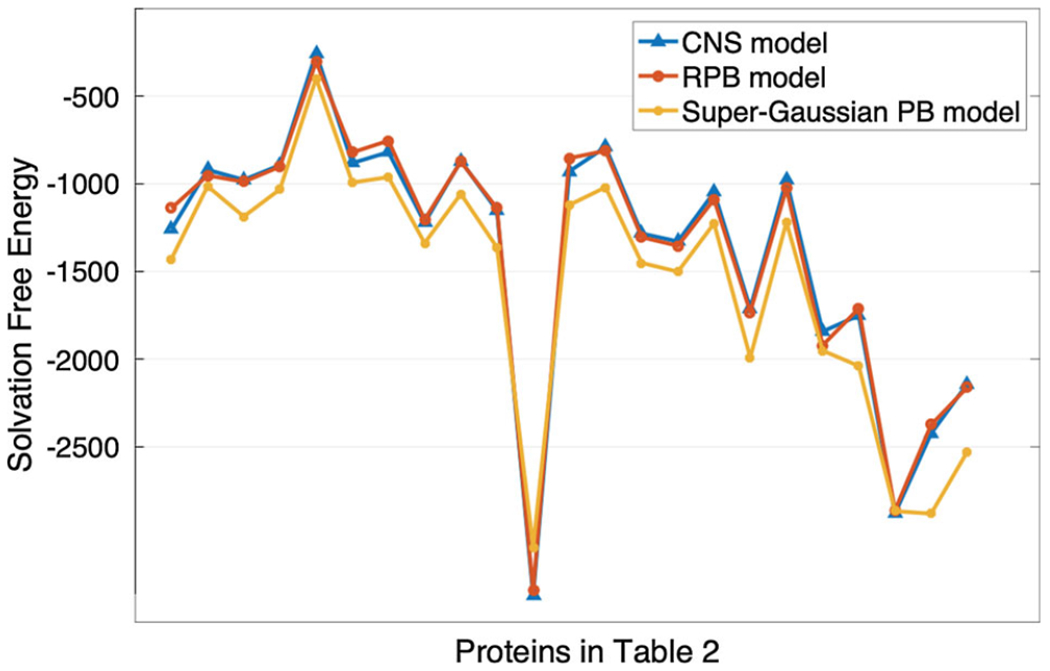
Comparing the super-Gaussian results with coupled nonlinear solvation (CNS) and regularized PB (RPB) models. Along x-axis, the proteins are listed according to the order of Table 2 and along y-axis the solvation free energies (in KCal/mol) are plotted