Fig. 2.

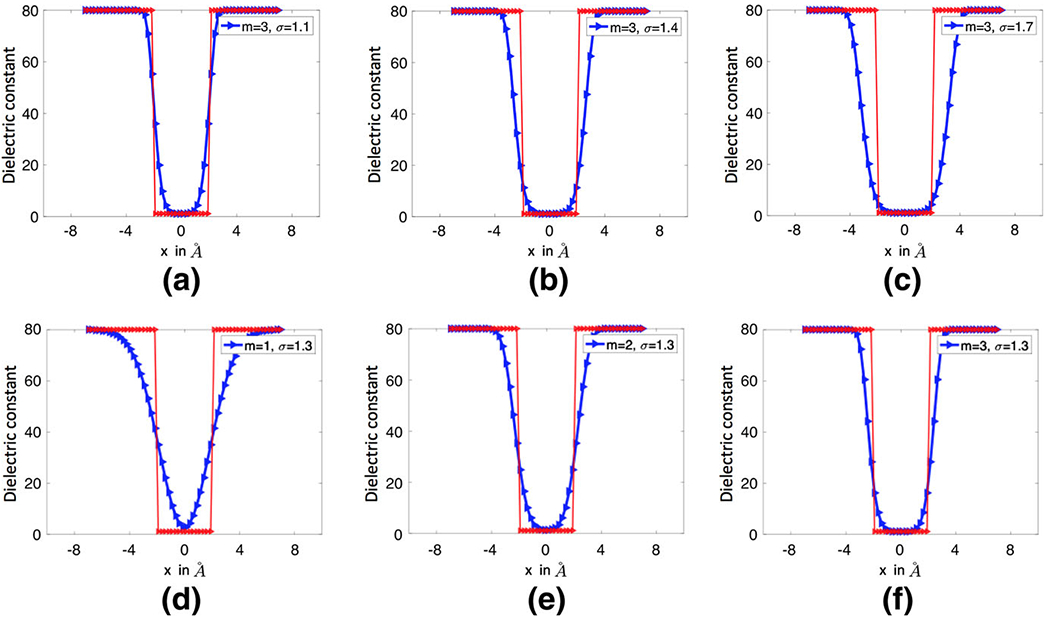
The dielectric distributions generated by the super Gaussian functions for a one-atom system. In all figures, the red line represents the piecewise constant of the two dielectric model

The dielectric distributions generated by the super Gaussian functions for a one-atom system. In all figures, the red line represents the piecewise constant of the two dielectric model