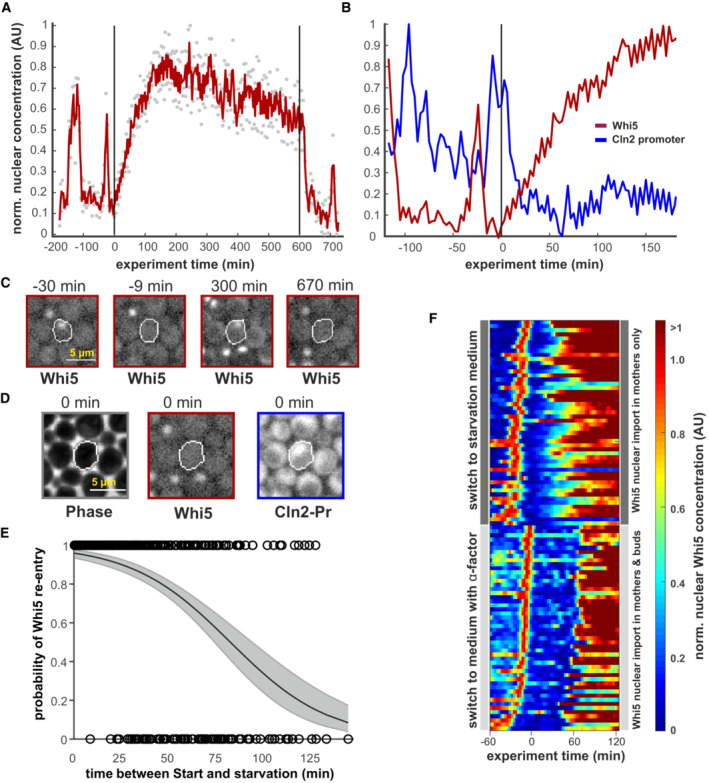
Figure 2. Whi5 re‐enters the nucleus upon starvation.

- Whi5‐mCherry trace of an example cell that re‐imports Whi5 upon starvation. Gray dots represent raw data, the red line results from a Savitzky–Golay smooth. Starvation was induced at t = 0 min and relieved after 10 h as indicated by the vertical black lines. Increase in nuclear fluorescence can be attributed mainly to nuclear import and not to overall increase in Whi5 (Appendix Figs S3 and S4).
- Images of the cell trace shown in (A) at indicated time points. Scale bar = 5 μm.
- Images from the cell shown in (C) at the time point immediately before starvation is induced. Absence of Whi5 and presence of the Cln2 reporter in the nucleus indicate that this cell had passed Start when it was exposed to starvation. See also Movie EV1. Scale bar = 5 μm.
- The probability of Whi5 nuclear re‐entry after starvation. Black circles indicate single cells (n = 849, from five independent experiments) that translocate Whi5 back into the nucleus. The x‐axis denotes the time that had passed since Whi5 exit until the medium was switched to starvation medium. The black line indicates a logistic regression of the single‐cell data, where the gray area denotes the 95% confidence intervals.
- Heatmap of nuclear Whi5 traces from 50 example cells (subset of E) that passed Start within 30 min before the switch to starvation. These are compared to 50 example cells that had the same initial conditions, but were then exposed to 10 μM α‐factor a t = 0 min. Traces were scaled to the maximum of the G1 peak before the switch.
