
Figure EV2. Extended information for Fig 6 .
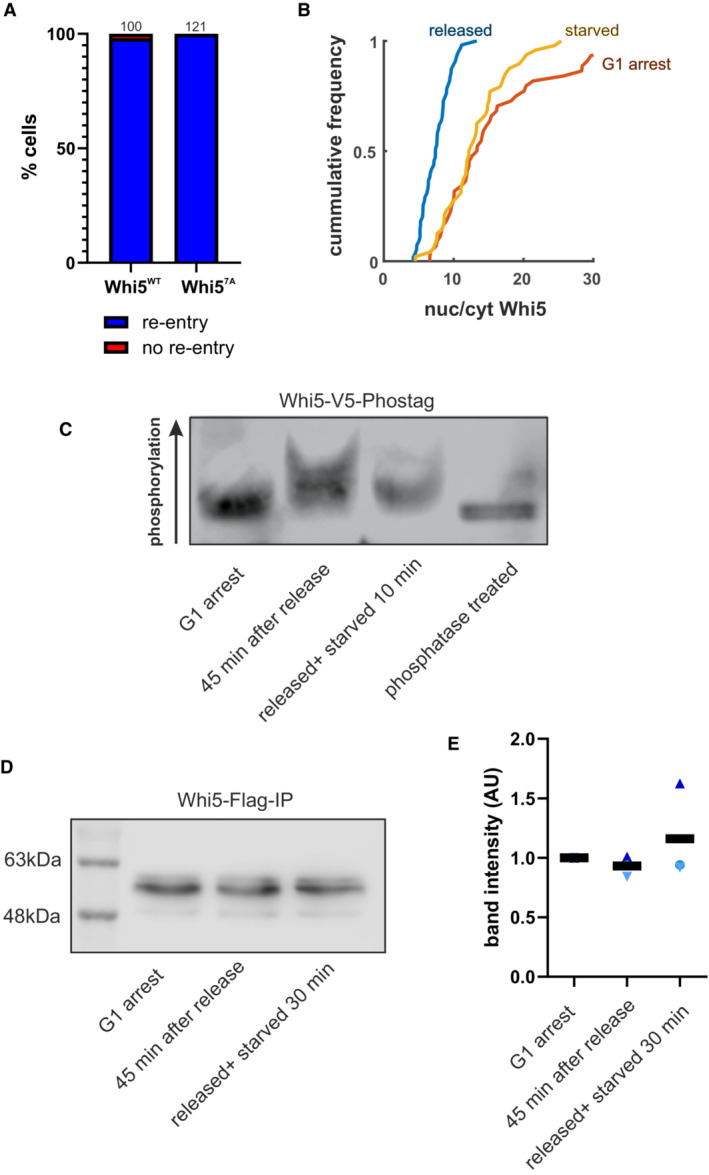
- We introduced wild‐type or the 7A phosphorylation site mutant (S78, S113, T114, S149, S276, T281, S288 mutated to alanine) Whi5 into a whi5‐deletion strain and determined its response to starvation. Bars indicate the fraction of cells that re‐import Whi5 when starved within 15 min after Start. Numbers over the bars indicate total number of cells that were analyzed.
- The histograms depicting Whi5 nuclear‐to‐cytoplasm ratios of Fig 6C are plotted as cumulated frequencies for direct comparison.
- Representative Western blot showing the amount of Whi5 protein pulled down in ChIP experiments (Fig 6E).
- Quantification of Western blots from three independent ChIP experiments as described in Fig 6E.