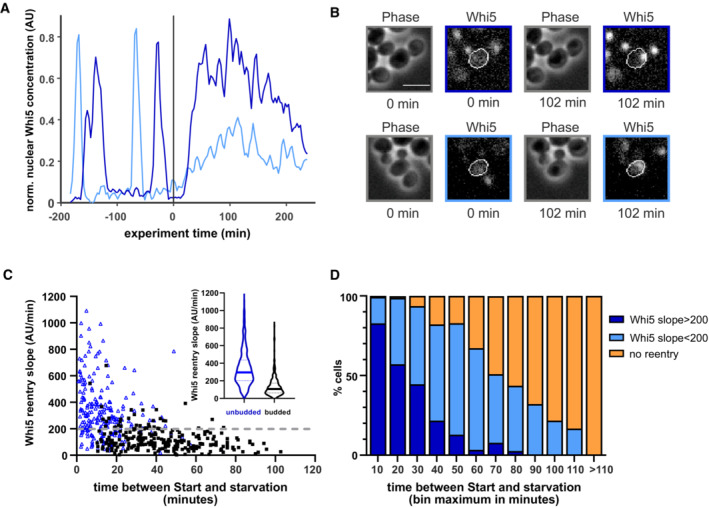
Figure 3. Early and late Whi5 re‐entries.

- Example traces of Whi5 of two cells exposed to starvation at t = 0 min. The dark blue line indicates a cell with a fast and steep re‐entry, and the light blue line indicates a cell with a slow re‐entry.
- Images of the two cells described in (A) at the indicated time points. Scale bar = 5 μm.
- We determined the slope of Whi5 nuclear re‐entry (regression of the first 30 min of nuclear Whi5 increase) in budded (black squares) and unbudded cells (blue triangle). We analyzed 680 cells from 5 replicate experiments. We picked 200 AU/min (dotted gray line) as the threshold between fast and slow re‐entries. Inset shows a violine plot of the slopes of all budded (black) and unbudded (blue) cells, where the solid lines depict the median of the distribution, and the dashed lines represent 25th and 75th percentiles.
- Distribution of fast, slow, and no re‐entries depending on how long after Start cells experience starvation (849 cells from five replicate experiments).
