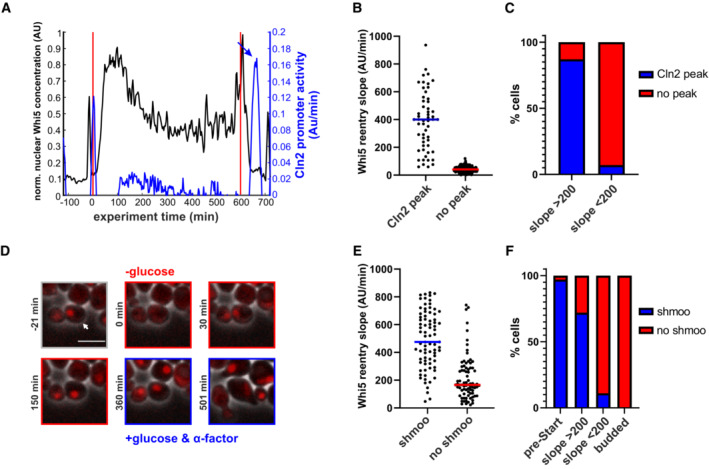
Figure 4. Early Whi5 re‐entries lead to functional Start reversal.

- Example cell showing that the Cln2 promoter (blue) fires upon glucose replenishment after Whi5 re‐entry (black). Vertical red lines indicate beginning and end of the starvation phase. The promoter activity was approximated by the change in fluorescence of a Cln2‐Promoter‐Neongreen construct (see also Appendix Fig S2). Arrow indicates Cln2 promoter activity peak after glucose replenishment.
- Whi5 re‐entry slopes of cells with and without Cln2 promoter activity after glucose replenishment (153 cells from three replicate experiments).
- Percentage of cells that show Cln2 promoter after glucose replenishment in cells that re‐imported Whi5 with slopes above or below our threshold of 200. Cells without Whi5 re‐entry never showed a Cln2 promoter activity peak after glucose replenishment. A Cln2 promoter peak after glucose replenishment was scored as such, if within 30 min after Whi5 exit, the slope of Cln2‐Promoter‐Neongreen fluorescence increase reached at least 50% of the pre‐starvation peak.
- Example cell that re‐imports Whi5 after starvation and responds to alpha factor after glucose replenishment. See also Movie EV2. Scale bar = 5 μm. Arrow indicates peak in Cln2 promoter activity after glucose replenishment.
- Whi5 re‐entry slopes of cells that shmoo or do not shmoo after glucose replenishment and alpha factor addition.
- Percentage of cells that respond to alpha factor addition by shmooing. The first bar describes cells that were arrested in a normal pre‐Start G1. The two middle bars include cells that exported and re‐imported Whi5 with no visible buds. The right bar includes all cells that were budded at the time of starvation and glucose replenishment.
